Question 1:
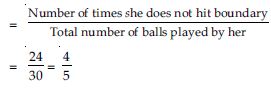
In a cricket match, a batswoman hits a boundary 6 times out of 30 balls she plays.
Find the probability that she did not hit a boundary.
Answer:
Total number of balls played by batswoman
= 30
Number of balls hit the boundary = 6
Number of balls not hit the boundary = 30 – 6 = 24
P (batswoman will not hit the boundary in next ball)
Question 2:
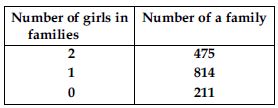
1500 families with 2 children were selected randomly and the following data were
recorded:
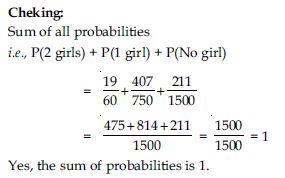
Compute the probability of a family, chosen at random, having
2 girls
Also check whether the sum of these probabilities is 1.
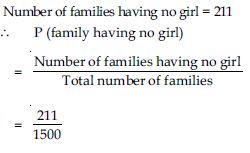
Answer:
Total number of families = 1500
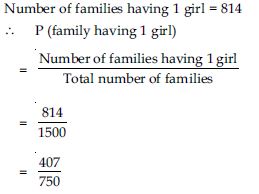
Number of families having 2 girls = 475
Probability of a family having 2 girls i.e., P (family having 2 girls)
Question 3:
1500 families with 2 children were selected randomly and the following data were
recorded:
Compute the probability of a family, chosen at random, having
1 girls
Also check whether the sum of these probabilities is 1.
Answer:
Question 4:
1500 families with 2 children were selected randomly and the following data were
recorded:
Compute the probability of a family, chosen at random, having
no girls
Also check whether the sum of these probabilities is 1.
Answer:
Question 5:
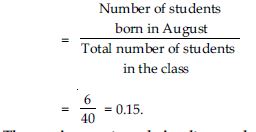
In a particular section of Class IX, 40 students were asked about the months of their birth and the following graph was prepared for the data so obtained:
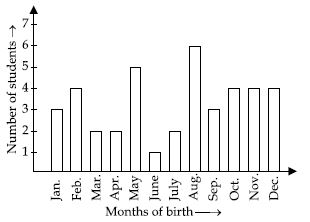
Find the probability that a student of the class was born in August.
Answer:
From the bar graph we observe that: Total number of students of Class IX = 40 Number of
students of Class IX born in August = 6
P (a student born in August)
Question 6:
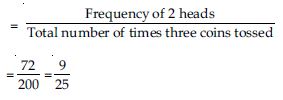
Three coins are tossed simultaneously 200 times with the following frequencies of different outcomes:
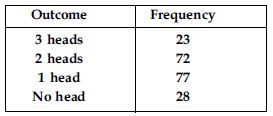
If the three coins are simultaneously tossed again, compute the probability of 2 heads coming up.
Answer:
Total number of times three coins tossed = 200
Frequency of 2 heads coming up = 72
The probability of 2 heads coming up i.e.,
P (2 heads coming up)
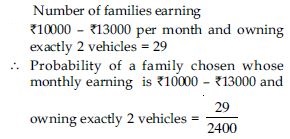
Question 7:
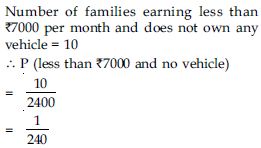
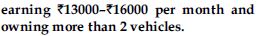
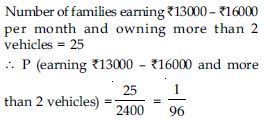
An Organisation selected 2400 families at random and surveyed them to determine a relationship between income level and the number of vehicles in a family. The information gathered is listed in the table below:
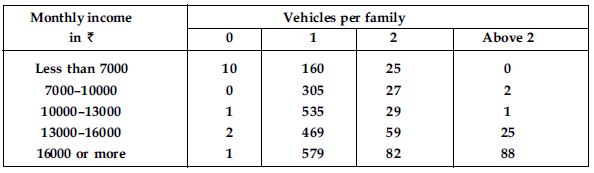
Suppose a family is chosen. Find the probability that the family chosen is:
Answer:
Total number of families surveyed by a company = 2400
Question 8:
An Organisation selected 2400 families at random and surveyed them to determine a relationship between income level and the number of vehicles in a family. The information gathered is listed in the table below:
Answer:
Total number of families surveyed by a company = 2400
Question 9:
An Organisation selected 2400 families at random and surveyed them to determine a relationship between income level and the number of vehicles in a family. The information gathered is listed in the table below:
Answer:
Total number of families surveyed by a company = 2400
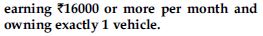
Question 10:
An Organisation selected 2400 families at random and surveyed them to determine a relationship between income level and the number of vehicles in a family. The information gathered is listed in the table below:
Answer:
Total number of families surveyed by a company = 2400
Question 11:
An Organisation selected 2400 families at random and surveyed them to determine a relationship between income level and the number of vehicles in a family. The information gathered is listed in the table below:
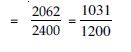
owning not more than 1 vehicle.
Answer:
Total number of families surveyed by a company = 2400
Number of families not having more than 1 vehicle
= Number of families having no vehicle + Number of families having only 1 vehicle = (10 + 0
+ 1 + 2 + 1) + (160 + 305 + 535 + 469 + 579) = 14 + 2048 = 2062
P (a family owning not more than 1 vehicle)
Question 12:
A teacher analyses the performance of two sections of students in a mathematics test of 100 marks given in the following table:
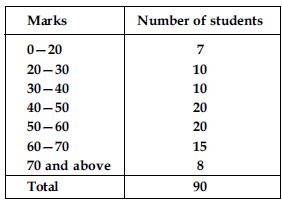
Find the probability that a student obtained less than 20% in the mathematics test.
Answer:
Number of students obtaining marks less than
20 out of 100 i.e., less than 20% = 7
Total students in the class = 90
P (a student obtained less than 20%)

Question 13:
A teacher analyses the performance of two sections of students in a mathematics test of 100 marks given in the following table:
Find the probability that a student obtained marks 60 or above.
Answer:
Number of students obtaining marks 60 or above = 15 + 8
= 23
Total number of students = 90
P (a student obtained marks 60 or above)

Question 14:
To know the opinion of the students about the subject statistics, a survey of 200 students was conducted. The data is recorded in the following table:
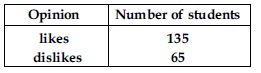
Find the probability that a student chosen at random
likes statistics
Answer:
Total number of students on which the survey about the subject of statistics was conducted =
200
Number of students who like statistics = 135
P (a student likes statistics)
Question 15:
To know the opinion of the students about the subject statistics, a survey of 200 students was conducted. The data is recorded in the following table:
Find the probability that a student chosen at random
does not like it
Answer:
Total number of students on which the survey about the subject of statistics was conducted =
200
Number of students who do not like (dislike) statistics = 65
P (a student does not like statistics)
Question 16:
Refer Q. 2, Exercise 14.2.(Thirty boys in the same age group were tested to find their pulse
rate. The following figures were obtained for the number of beats per minute. Using the
class-intervals 51–55, 55–60 etc. of equal width prepare a frequency table.
55, 72, 70, 66, 74, 70, 74, 53, 57, 62, 71, 58, 68,
75, 79, 68, 63, 59, 54, 51, 61, 66, 78, 73, 59, 52,
66, 60, 72, 56)
What is the empirical probability that an engineer lives:
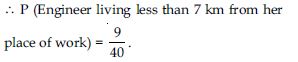
less than 7 km from her place of work?
Answer:
Number of engineers living less than 7 km from
her place of work = 9
Total number of engineers = 40
Question 17:
Refer Q. 2, Exercise 14.2.(Thirty boys in the same age group were tested to find their pulse
rate. The following figures were obtained for the number of beats per minute. Using the
class-intervals 51–55, 55–60 etc. of equal width prepare a frequency table.
55, 72, 70, 66, 74, 70, 74, 53, 57, 62, 71, 58, 68,
75, 79, 68, 63, 59, 54, 51, 61, 66, 78, 73, 59, 52,
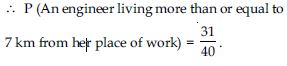
66, 60, 72, 56) What is the empirical probability that an engineer lives:
more than or equal to 7 km from her place of work?
Answer:
Number of engineers living more than or equal
to 7 km from her place of work = 31
Total number of engineers = 40
Question 18:
Refer Q. 2, Exercise 14.2.(Thirty boys in the same age group were tested to find their pulse
rate. The following figures were obtained for the number of beats per minute. Using the
class-intervals 51–55, 55–60 etc. of equal width prepare a frequency table.
55, 72, 70, 66, 74, 70, 74, 53, 57, 62, 71, 58, 68,
75, 79, 68, 63, 59, 54, 51, 61, 66, 78, 73, 59, 52,
66, 60, 72, 56)
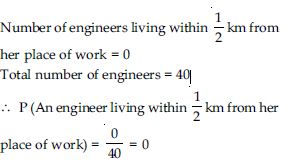
What is the empirical probability that an engineer lives:

Answer:
Question 19:
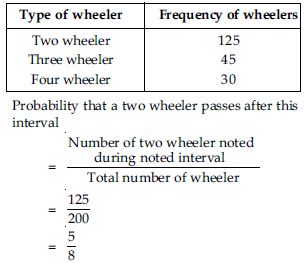
Activity: Note the frequency of two wheelers, three wheelers and four wheelers going past during a time interval, in front of your school gate. Find the probability that any one vehicle out of the total vehicles you have observed is a two wheeler.
Answer:
Let the frequency of types of wheelers after school time (i.e., 3 p.m. to 3.30 p.m.) for half
an hour.
Let the following table shows the frequency of wheelers.
Question 20:
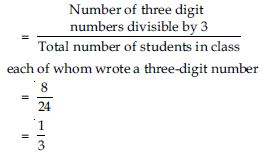
Activity: Ask all the students in your class room to write a 3-digit number. Choose any student from the room at random. What is the probability that the number written by him is divisible by 3? Remember that a number is divisible by 3, if the sum of its digits is divisible by 3.
Answer:
Let number of students in your class is 24.
Let a 3-digit number written by each of them is as follows:
837, 172, 643, 371, 124, 512, 432, 948, 311, 252, 999, 557, 784, 928, 867, 798, 665, 245,
107, 463, 267, 523, 944, 314.
Number divisible by 3 are: 837, 432, 948, 252, 999, 867, 798 and 267
3-digit numbers divisible by 3 are 8 in number.
P (a 3-digit number divisible by 3)
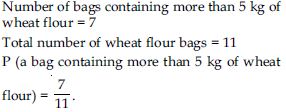
Question 21:
Eleven bags of wheat flour, each marked 5 kg, actually contained the following weights of
flour (in kg):
4.97, 5.05, 5.08, 5.03, 5.00, 5.06, 5.08, 4.98, 5.04, 5.07, 5.00. Find the probability that
any of these bags chosen at random contains more than 5 kg of flour.
Answer:
Question 22:
In Q. 1, Exercise 14.2(Time taken in seconds by 25 students to solve a question is given
below:
20, 16, 20, 26, 27, 28, 30, 33, 37, 50, 40, 42, 46,
38, 43, 46, 46, 48, 49, 53, 58, 59, 60, 64, 52.
By taking class interval of 10 seconds, make a frequency table.)
you were asked to prepare a frequency distribution table regarding the blood groups of 30
students of a class. Use this table to determine the probability that a student of this
class, selected at random, has blood group AB.
Answer:
From the frequency distribution table we observe that,
Number of students having blood group AB = 3
Total number of students whose blood group were recorded = 30
P (a student having blood group AB)
