Question 1:
If we change the position of any of the bars of a bar graph, would it change the information being conveyed? Why?
Answer:
No, information on the bar graph is conveyed by the bar height. So, if the change the position of any of the bars of a bar graph, keeping the bar heights unchanged, the information conveyed does not change.
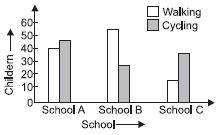
Question 2:
Draw an appropriate graph to represent the given information.
Answer:
Question 3:
Answer:
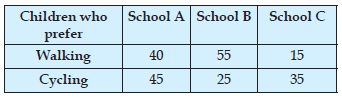
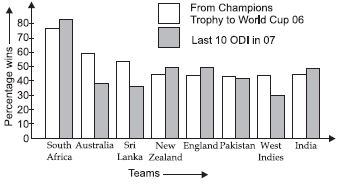
Question 4:
Percentage wins in ODI by 8 top cricket teams.
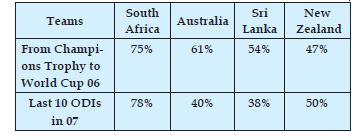
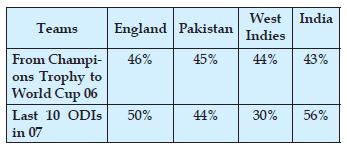
Answer:
Question 5:
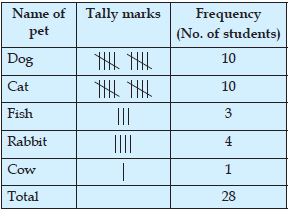
A group of students were asked to say which animal they would like most to have as a pet. The results are given below:
dog, cat, cat, fish, cat, rabbit, dog, cat, rabbit,
dog, cat, dog, dog, dog, cat, cow, fish, rabbit,
dog, cat, dog, cat, cat, dog, rabbit, cat, fish, dog.
Make a frequency distribution table for the same.
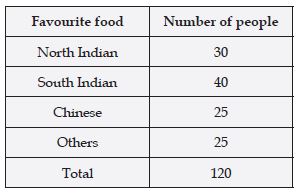
Answer:
We arrange the data in a frequency table using tally marks:
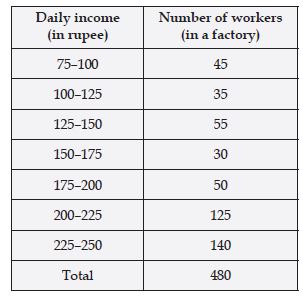
Question 6:
Study the following distribution table and
answer the questions given below:
Frequency distribution of daily income of 550
workers of a factory?

(i) What is the size of the class intervals?
(ii) Which class has the highest frequency?
(iii) Which class has the lowest frequency?
(iv) What is the upper limit of the class
interval 250–275?
(v) Which two classes have the same
frequency?
Answer:
(i) 25 (ii) 200–225 (iii) 300–325 (iv) 275 (v) 150–175 and 225–250.
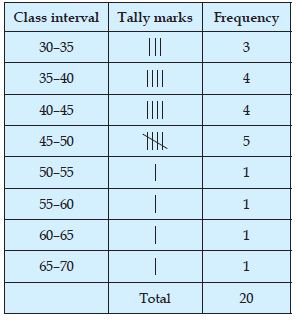
Question 7:
Construct a frequency distribution table for
the data on weights (in kg) of 20 students of a
class using intervals 30–35, 35–40 and so on.
40, 38, 33, 48, 60, 53, 31, 46, 34, 36, 49, 41, 55, 49,
65, 42, 44, 47, 38, 39.
Answer:
Question 8:
Observe the histogram (fig.) and answer the questions given below:
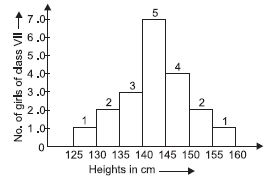
(i) What information is being given by the
histogram?
(ii) Which group contains maximum girls?
(iii) How many girls have a height of 145 cm
and more?
(iv) If we divide the girls into the following
three categories, how many would there
be in each?
150 cm and more Group – A
140 cm to less than 150 cm Group – B
Less than 140 cm Group – C.
Answer:
(i) Heights of girls of class VII.
(ii) 140 cm to less than 145 cm i.e., (140 – 145).
(iii) Number of girls having heights more than
145 cm is (4 + 2 + 1) = 7.
(iv) Group A (2 + 1) = 3
Group B (7 + 4) = 11
Group C (1 + 2 + 3) = 6
Question 9:
For which of these would you use a histogram
to show the data?
(a) The number of letters for different areas in a postman’s bag.
(b) The height of competitors in an athletics meet.
(c) The number of cassettes produced by 5 companies.
(d) The number of passengers boarding trains
from 7: 00 a.m. to 7: 00 p.m. at a station.
Give reasons for each.
Answer:
In case (b) and case (d), we need to group the data, because, in case (a) and case (c) we have been given the names of areas and companies respectively. So, there is no need to group the data in these cases.
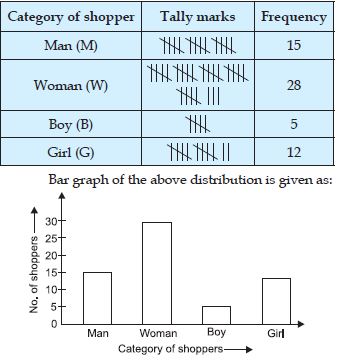
Question 10:
The shoppers who come to a departmental
store are marked as: Man (M), Woman (W),
Boy (B) or Girl (G). The following list gives
the shoppers who came during the first hour
in the morning:
W W W G B W W M G G M M W W W W G B M W B G G M W W M M W W W M W B W G M W W W W G W M M W W M W G W M G W M M B G G W
Make a frequency distribution table using
tally marks. Draw a bar graph to illustrate it.
Answer:
The frequency distribution table using tally marks is as given below:
Question 11:
The weekly wages (in ₹) of 30 workers in a
factory are:
830, 835, 890, 810, 835, 836, 869, 845, 898, 890, 820, 860, 832, 833, 855, 845, 804, 808, 812, 840, 885, 835, 835, 836, 878, 840, 868, 890, 806, 840.
Using tally marks make a frequency table
with intervals as 800–810, 810–820 and so on.
Answer:
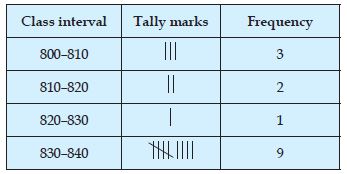
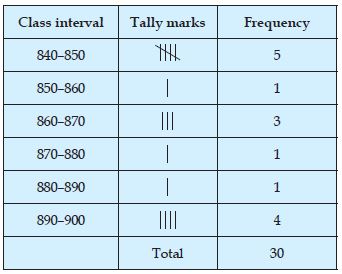
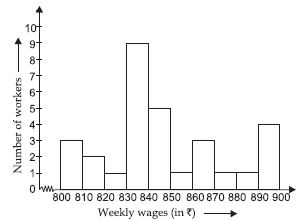
Question 12:
The weekly wages (in ₹) of 30 workers in a
factory are:
830, 835, 890, 810, 835, 836, 869, 845, 898, 890, 820, 860, 832, 833, 855, 845, 804, 808, 812, 840, 885, 835, 835, 836, 878, 840, 868, 890, 806, 840.
Draw a frequency table with intervals as 800–810, 810–820 and so on, and a histogram then answer the following questions:
(i) Which group has the maximum number of workers?
(ii) How many workers earn ₹850 and more?
(iii) How many workers earn less than ₹850?
Answer:
The histogram of the above data is represented
in the figure.
(i) 830–840, number of workers in this group is 9.
(ii) 10
(iii) 20
Question 13:
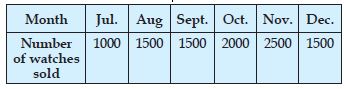
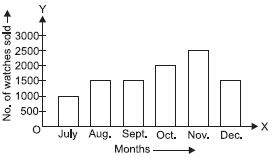
The number of hours for which students of a particular class watched television during holidays is shown through the given graph.
Answer the following.
(i) For how many hours did the maximum number of students watch TV?
(ii) How many students watched TV for less than 4 hours?
(iii) How many students spent more than 5 hours in watching TV?
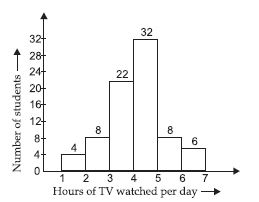
Answer:
(i) 4–5 hours. Number of students 32.
(ii) 34
(iii) 14
Question 14:
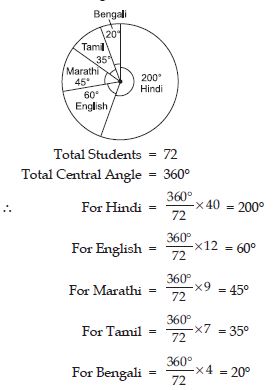
Each of the following pie charts gives you a different piece of information about your class. Find the fraction of the circle representing each of these information.
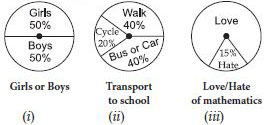
Answer:
Question 15:
Answer the following questions based on the pie-chart as given in the figure.
(i) Which type of programmes are viewed the most?
(ii) Which two types of programmes have number of viewers equal to those
watching sports channels?
Answer:
(i) Entertainment programmes.
(ii) News and Informative.
Question 16:
Draw a pie chart of the data given below:
The time spent by a child during a day.
Sleep 8 hours
School 6 hours
Home work 4 hours
Play 4 hours
Others 2 hours
Answer:
We find the central angle of each sector.
Here, total hours in day = 24 hours.
∴ We have:
Question 17:
Which form of graph would be appropriate to display the following data:
Production of food grains of a state.
Answer:
Bar graph is an appropriate graph to display the given data.
Question 18:
Choice of food for a group of people.
Answer:
Pie chart is an appropriate graph to display the given data.
Question 19:
The daily income of a group of a factory workers.
Answer:
Histogram is an appropriate graph to display the given data.
Question 20:
A survey was made to find the type of music that a certain group of young people liked in a city. Adjoing pic chart shows the findings of this survey.
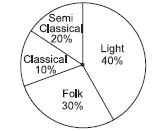
From this pie chart, answer the following:
(i) If 20 people liked classical music, how many young people were surveyed?
(ii) Which type of music is liked by the maximum number of people?
(iii) If a cassette company were to make 1000 CD’s, how many of each type would they make?
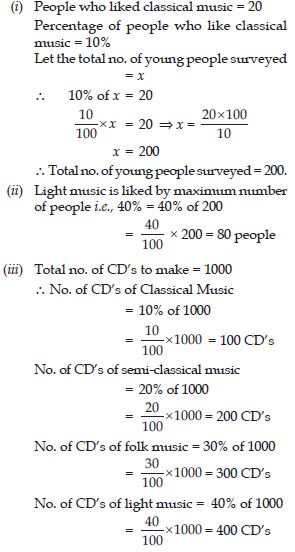
Answer:
Question 21:
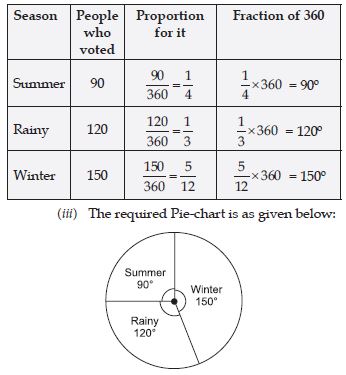
A group of 360 people were asked to vote for their favourite season from the three seasons rainy, winter and summer.
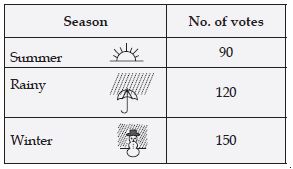
(i) Which season got the most votes?
(ii) Find the central angle of each sector.
(iii) Draw a pie chart to show this information.
Answer:
(i) Winter season = 150 votes.
(ii) Central angle of each sector
Question 22:
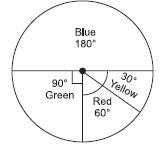
Draw a pie-chart showing the following information. The table shows the colours preferred by a group of people.
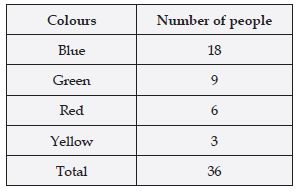
Answer:
In order to draw the pie-chart, we need to find their respective angles.

∴ The pie-chart of the above information, according to their respective angles as given in the table is as shown in the figure.
Question 23:
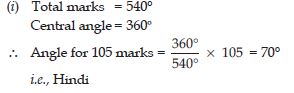
The adjoining pie chart gives the marks scored in an examination by a student in Hindi, English, Mathematics, Social Science and Science. If the total marks obtained by the students were 540, answer the following questions:
(i) In which subject did the student score 105 marks?
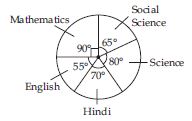
(Hint: For 540 marks, the central angle = 360°. So, for 105 marks what is the central angle.)
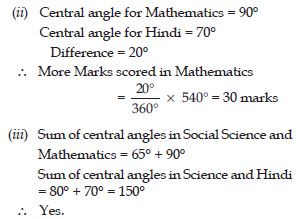
(ii) How many more marks were obtained by the student in Mathematics than in Hindi?
(iii) Examine whether the sum of the marks obtained in Social Science and Mathematics is more than that in Science and Hindi.
(Hint: Just study the central angles.)
Answer:
Question 24:
The number of students in a hostel, speaking different languages is given below. Display the data in a pie chart.
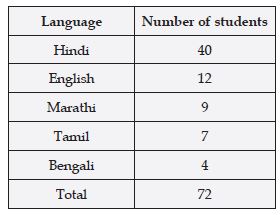
Answer:
Here, we have to convert the number of students in the central angles.
Question 25:
If you try to start a scooter, what are the possible outcomes?
Answer:
There are two possible outcomes either the scooter will start or will not start.
Question 26:
When a die is thrown, what are the six possible outcomes?
Answer:
The six possible outcomes are: {1, 2, 3, 4, 5, 6}
Question 27:
When you spin the wheel shown, what are the possible outcomes? (Fig.) List them.
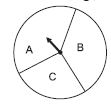
(Outcome here means the sector at which the pointer stops.)
Answer:
There are three possible outcomes. {A, B, C}
Question 28:
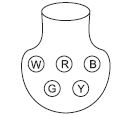
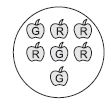
You have a bag with five identical balls of different colours and you are to pull out (draw) a ball without looking at it, list the outcomes you would get (Fig.)
Answer:
There are five possible outcomes. {W, R, B, G, Y}
Question 29:
In throwing a die:
Does the first player have a greater chance of getting a six?
Answer:
No.
Question 30:
In throwing a die:
Would the player who played after him have a lesser chance of getting a six?
Answer:
No.
Question 31:
In throwing a die:
Suppose the second player got a six. Does
it mean that third player would not have a
chance of getting a six?
Answer:
No, all the players have the equal chance of getting a six.
Question 32:
Suppose you spin the wheel
Answer:
Question 33:
List the outcomes you can see in these experiments.
(a) Spinning a wheel.
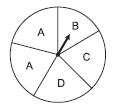
(b) Tossing two coins together.
Answer:
(a) Spinning a wheel:
The pointer may come on any of the five parts of the wheel.
∴ The possible outcomes are A, B, C, D and A.
(b) Tossing two coins together:
The possible outcomes are {HH, HT, TH, TT}.
Question 34:
When a die is thrown, list the outcomes of an event of getting:
(i) (a) a prime number.
(b) not a prime number
(ii) (a) a number greater than 5.
(b) a number not greater than 5.
Answer:
Total number of outcomes in a throw of single
dice is given by:
S = {1, 2, 3, 4, 5, 6}.
(i) (a) Outcomes of primes = {2, 3, 5}
(b) Outcome of not a prime number
= {1, 4, 6}
(ii) (a) Number greater than 5 = 6
(b) Number not greater than 5
= {1, 2, 3, 4, 5}.
Question 35:
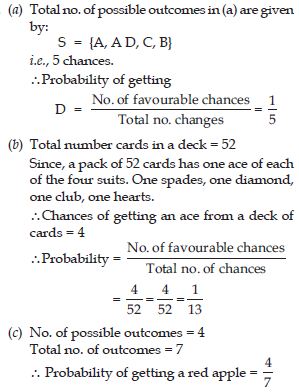
Find the
(a) Probability of the pointer stopping on D
in
(b) Probability of getting an ace from a well shuffled deck of 52 playing cards.
(c) Probability of getting a red apple from the given figure. (See figure below)
Answer:
Question 36:
Numbers 1 to 10 are written on ten separate
slips (one number on one slip), kept in a
box and mixed well. One slip is chosen from
the box without looking into it. What is the
probability of:
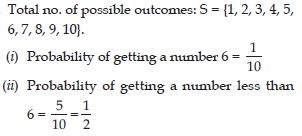
(i) getting a number 6?
(ii) getting a number less than 6?
(iii) getting a number greater than 6?
(iv) getting a 1-digit number?
Answer:
Question 37:
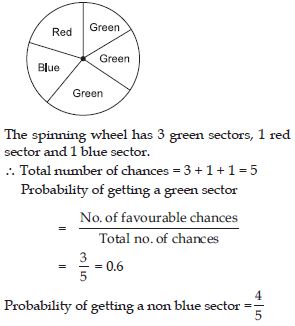
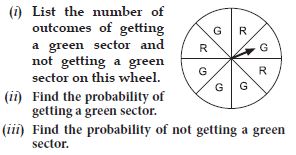
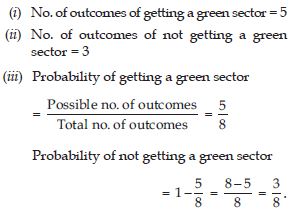
If you have a spinning wheel with 3 green sectors, 1 blue sector and 1 red sector, What is the probability of getting a green sector?
What is the probability of getting a non blue sector?
Answer: