Aasoka provides free free NCERT Solutions to help students grab a thorough understanding of the topics related to the chapter. Students can study from these solutions anytime as they are available online for free of cost. The NCERT Solutions for Class 11 makes it possible for students to score good grades in their exams because the experts have designed it in a way so as to fulfill their learning requirements. It is designed in accordance with the latest CBSE syllabus and guidelines.
“Statistics” chapter of Class 11 Maths teaches analysis of frequency distributions with equal means but different variances, the measure of dispersion, the standard deviation of grouped/ungrouped data, mean deviation, etc.
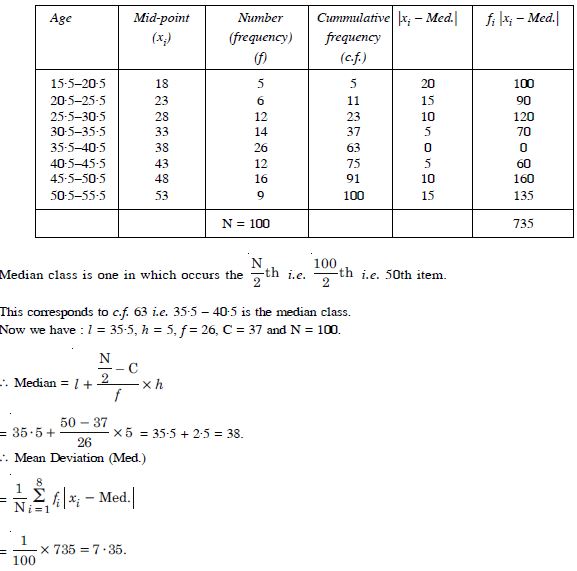
Question 1:
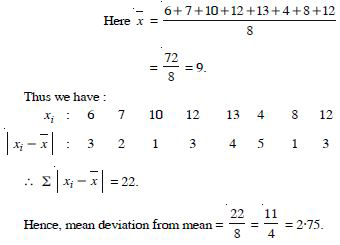
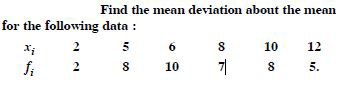
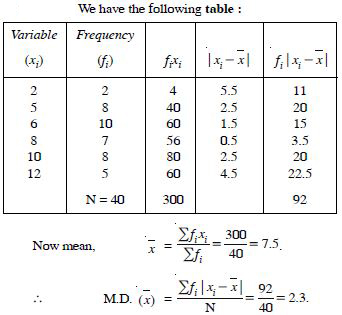
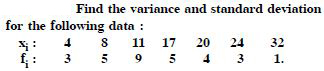
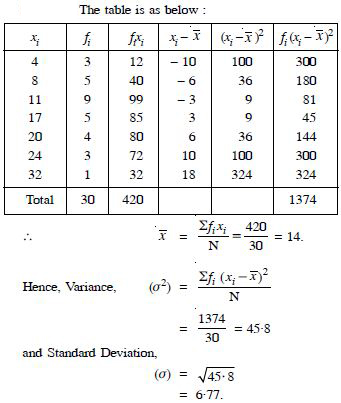
Find the mean deviation about the mean
for the following data :
6, 7, 10, 12, 13, 4, 8, 12.
Answer:
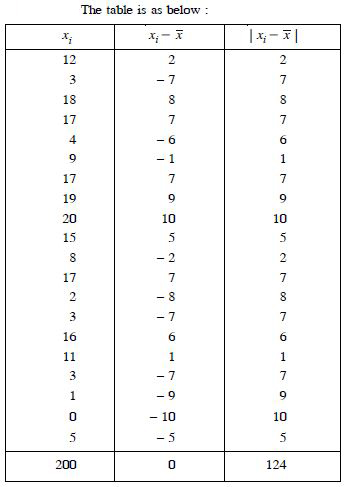
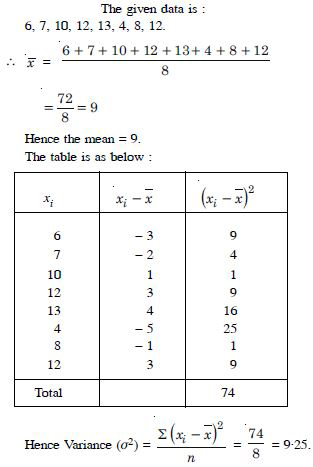
Question 2:
Find the mean deviation from the mean
for the following data :
12, 3, 18, 17, 4, 9, 17, 19, 20, 15, 8, 17, 2, 3, 16, 11, 3, 1, 0, 5.
Answer:
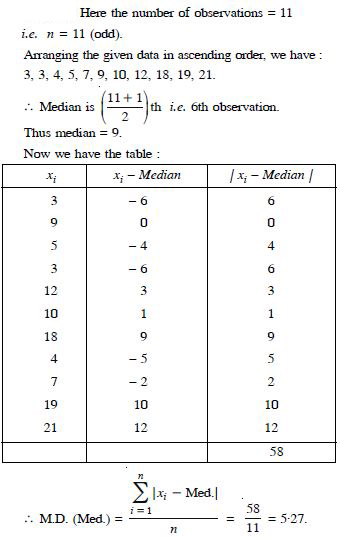
Question 3:
Find the mean deviation from the median for the following data :
3, 9, 5, 3, 12, 10, 18, 4, 7, 19, 21.
Answer:
Question 4:
Answer:
Question 5:
Answer:
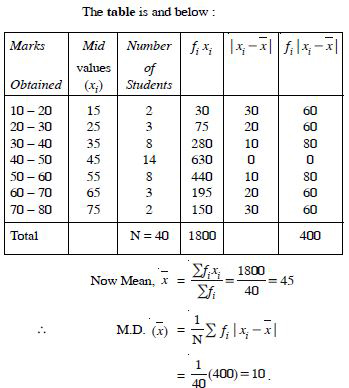
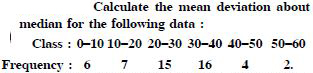
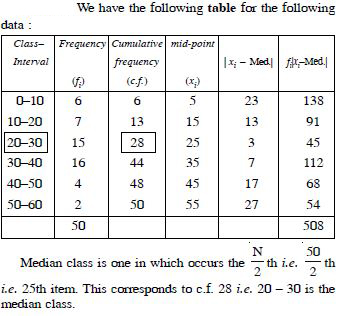
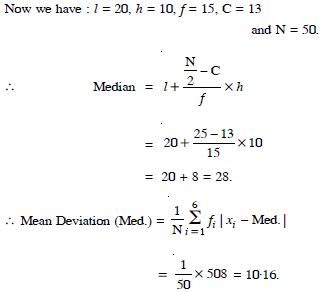
Question 6:
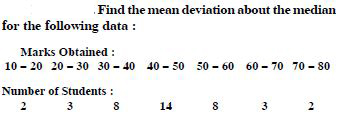
Answer:
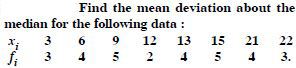
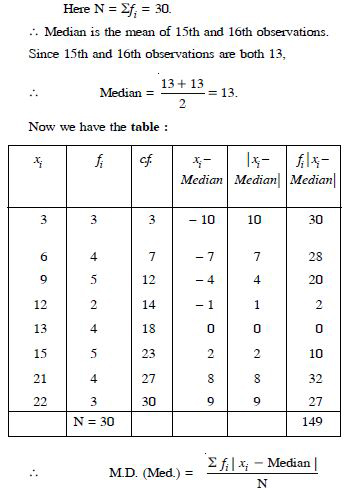
Question 7:
Answer:
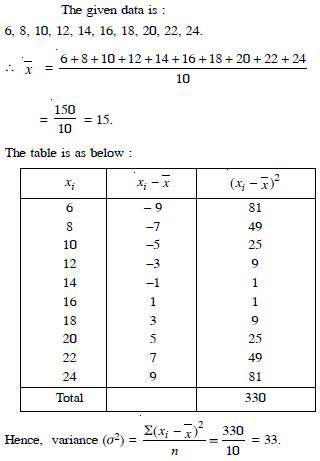
Question 8:
Find the variance of the following data :
6, 8, 10, 12, 14, 16, 18, 20, 22, 24.
Answer:
Question 9:
Answer:
Question 10:
Answer:
Question 11:
Answer:
Question 12:
Answer:
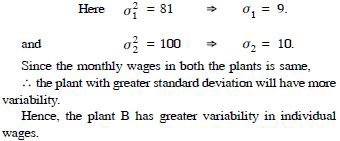
Question 13:
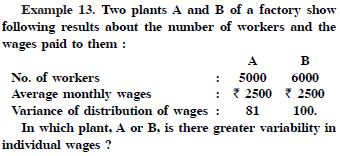
Answer:
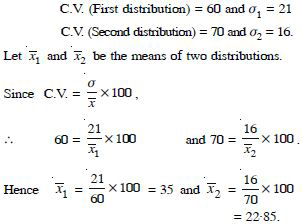
Question 14:
Coefficient of variations of two distributions are 60 and 70 and their standard deviations are 21 and 16 respectively. What are their arithmetic means ?
Answer:
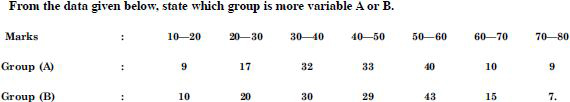
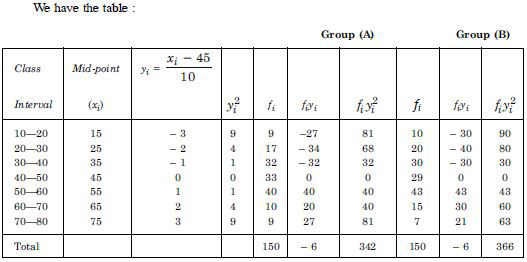
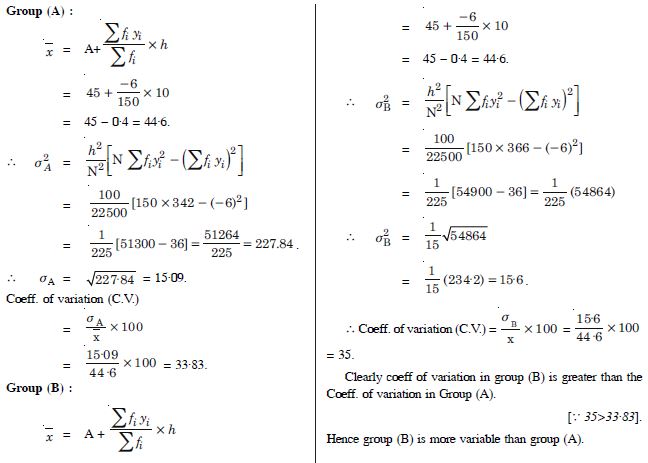
Question 15:
Answer:
Question 16:
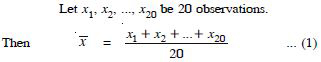
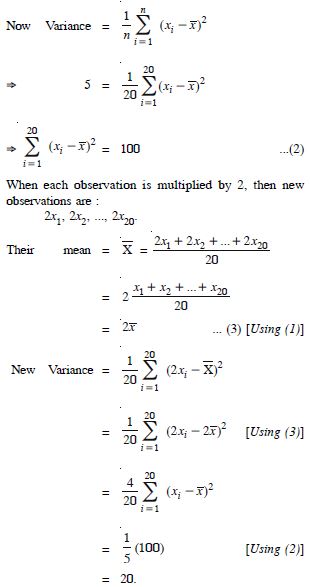
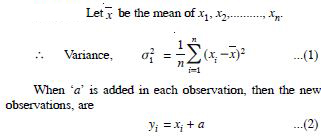
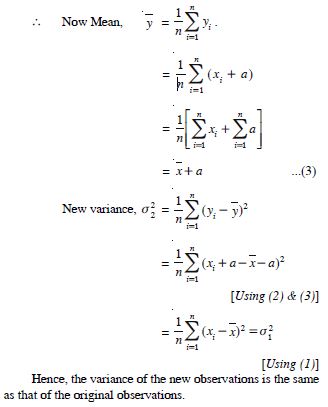
The variance of 20 observations is 5. If each observation is multiplied by 2, find the new variance of the resulting observations.
Answer:
Question 17:
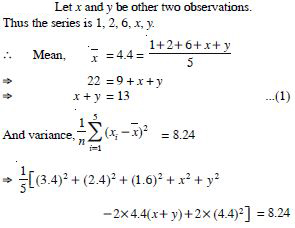
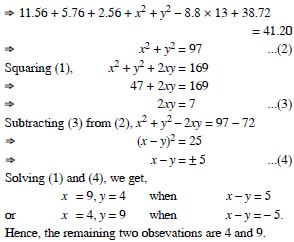
The mean of 5 observations is 4.4 and their variance is 8.24. If three of the observations are 1, 2 and 6, find the other two observations.
Answer:
Question 18:
Answer:
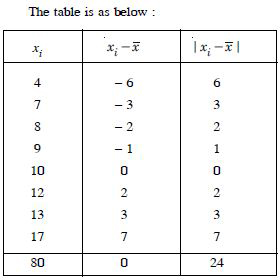
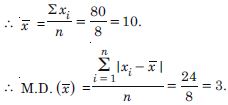
Question 19:
Find the mean deviation about the mean for the data in:
4, 7, 8, 9, 10, 12, 13, 17.
Answer:
Question 20:
Find the mean deviation about the mean for the data in:
38, 70, 48, 40, 42, 55, 63, 46, 54, 44.
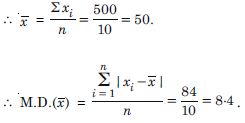
Answer:
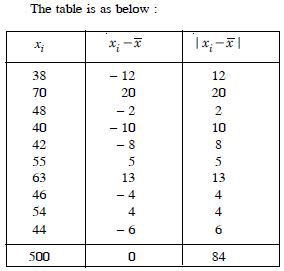
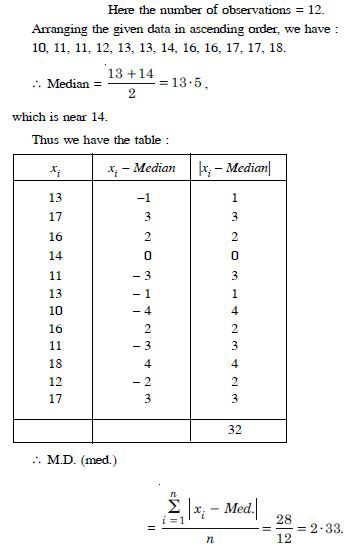
Question 21:
Find the mean deviation about the median for the data in:
13, 17, 16, 14, 11, 13, 10, 16, 11, 18, 12, 17.
Answer:
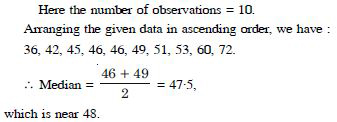
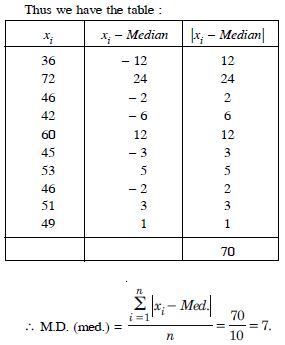
Question 22:
Find the mean deviation about the median for the data in:
36, 72, 46, 42, 60, 45, 53, 46, 51, 49.
Answer:
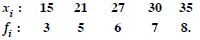
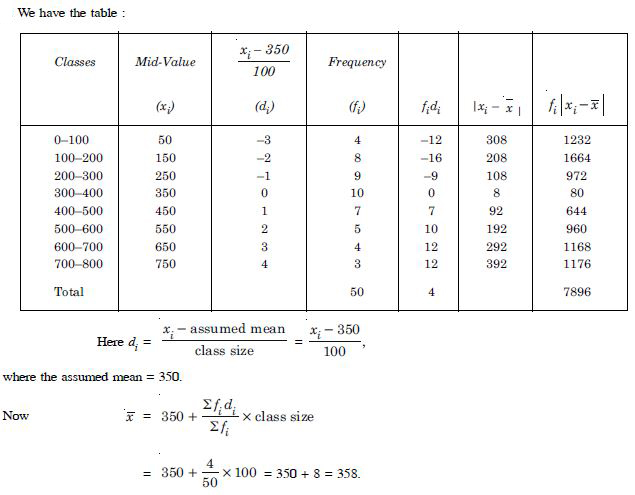
Question 23:
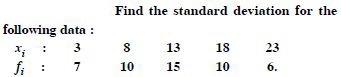
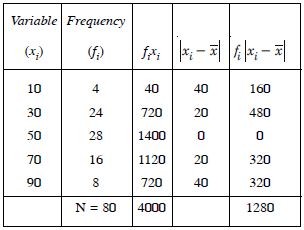
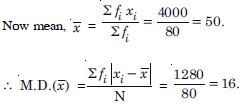
Find the mean deviation about the mean for the data in:
Answer:
Question 24:
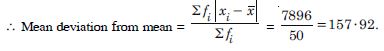
Find the mean deviation about the mean for the data in:
Answer:
Question 25:
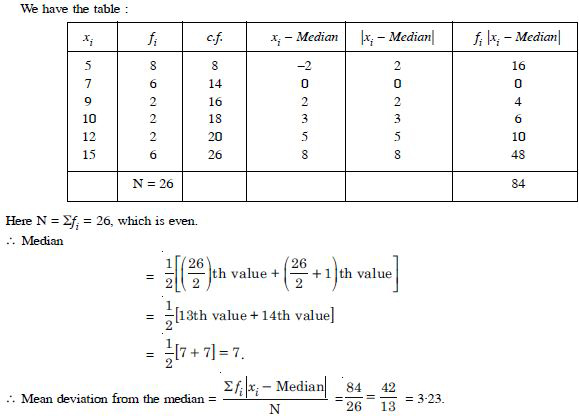
Find the mean deviation about the median for the data in:
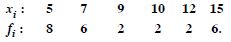
Answer:
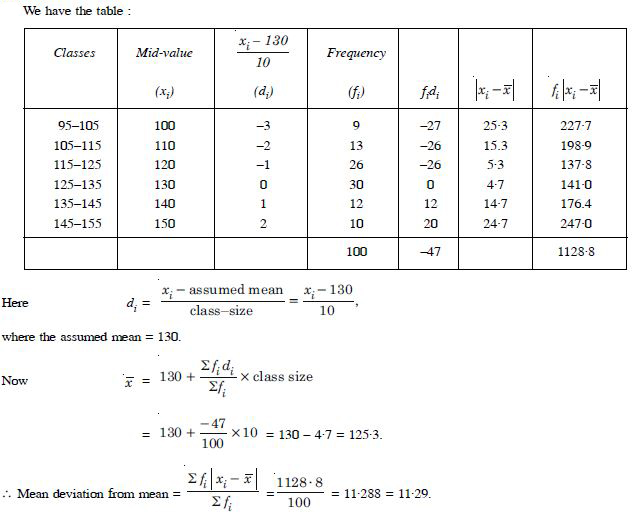
Question 26:
Find the mean deviation about the median for the data in:
Answer:
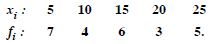
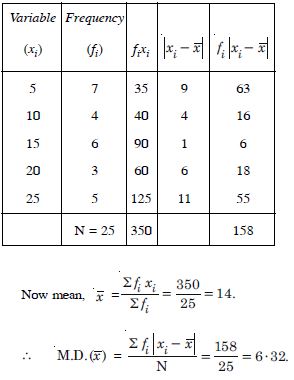
Question 27:
Find the mean deviation about mean for data in:
Answer:
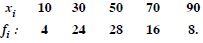
Question 28:
Find the mean deviation about mean for data in:

Answer:
Question 29:
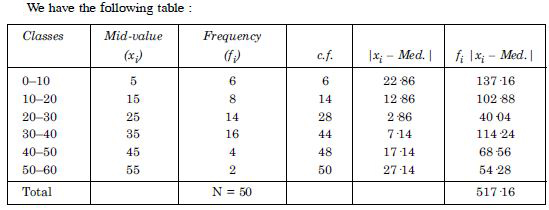
Find the mean deviation about median for the following data :
Answer:
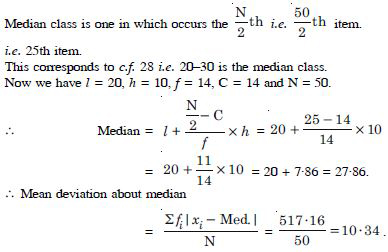
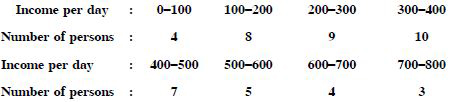
Question 30:
Calculate the mean deviation about median for the age distribution of 100 persons given below :

Answer:
Converting the given data into continuous frequency distribution by subtracting 0·5 from the lower and adding 0·5 to the upper limit of each class-interval, we have :
Question 31:
Find the mean and variance for the following data in:
6, 7, 10, 12, 13, 4, 8, 12.
Answer:
Question 32:
Find the mean and variance for the following data in:
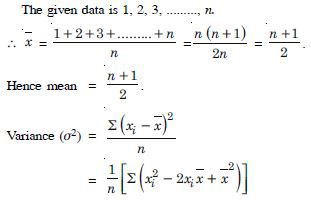
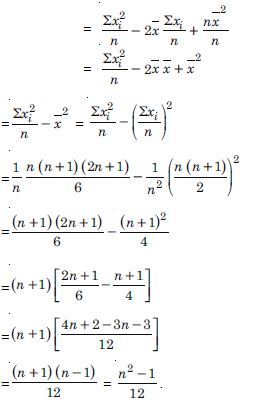
First n natural numbers.
Answer:
Question 33:
Find the mean and variance for the following data in:
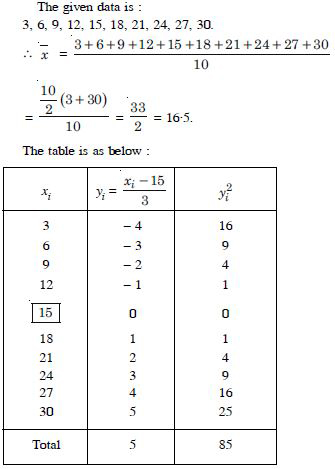
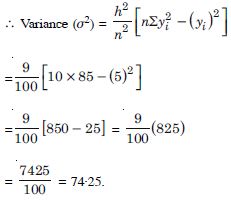
First 10 multiples of 3.
Answer:
Question 34:
Find the mean and variance for the following data in:
Answer:
Question 35:
Find the mean and variance for the following data in:
Answer:
Question 36:
Answer:
Question 37:
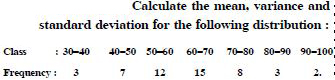
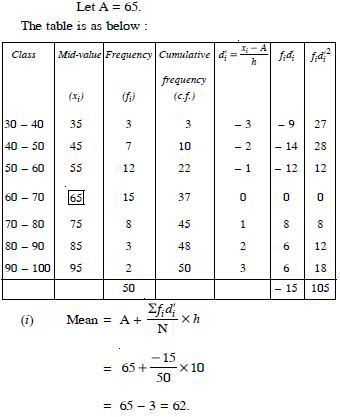
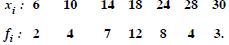
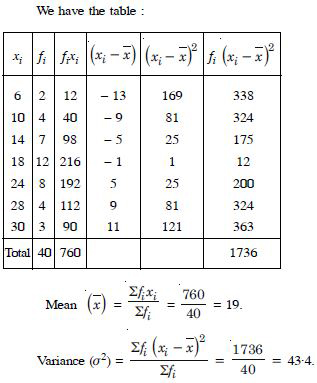
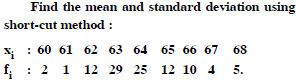
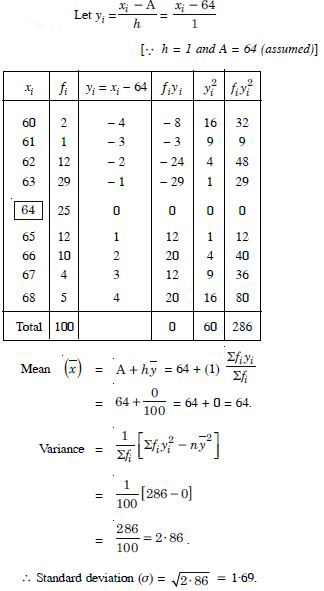
Find the mean and variance for the following distribution in:

Answer:
Question 38:
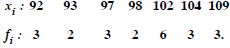
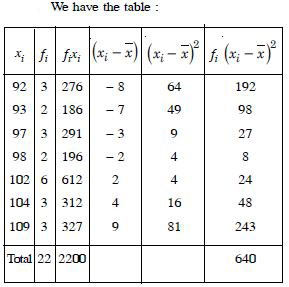
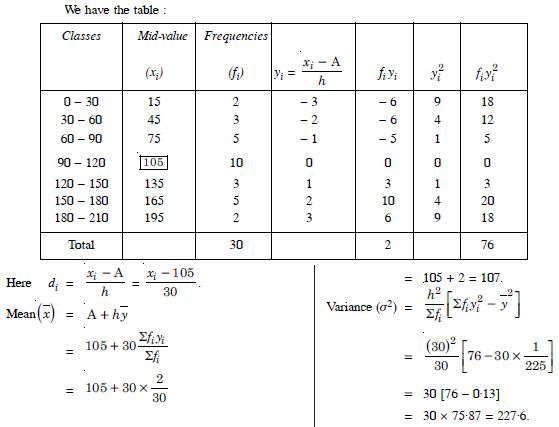
Find the mean and variance for the following distribution in:

Answer:
Question 39:
Answer:
Question 40:
Answer:
Converting the given data into continuous frequency distribution by subtracting 0·5 from the lower and adding 0·5 to the upper but of each class-interval, we have :
Question 41:
Answer:
Question 42:
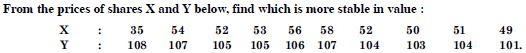
Answer:
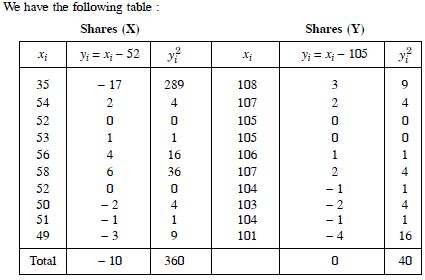
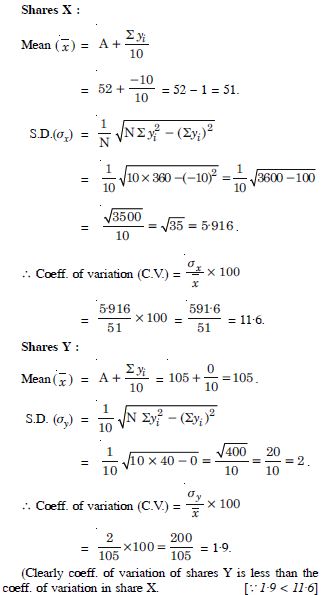
Hence the shares Y is more stable than the shares X.
Question 43:
Answer:
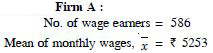
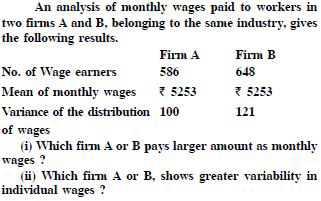
Question 44:
Answer:
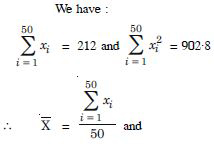
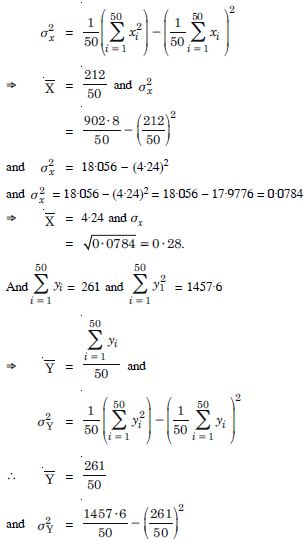
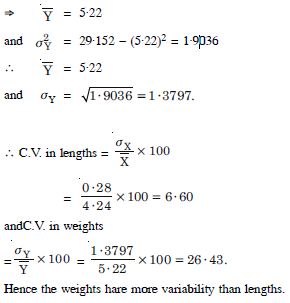
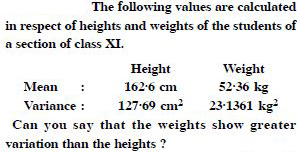
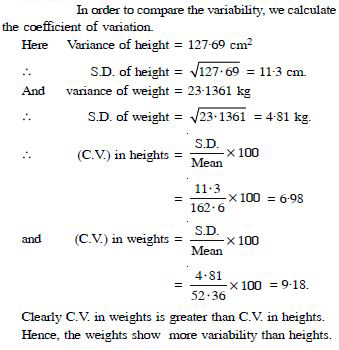
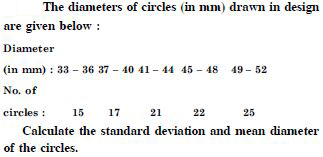
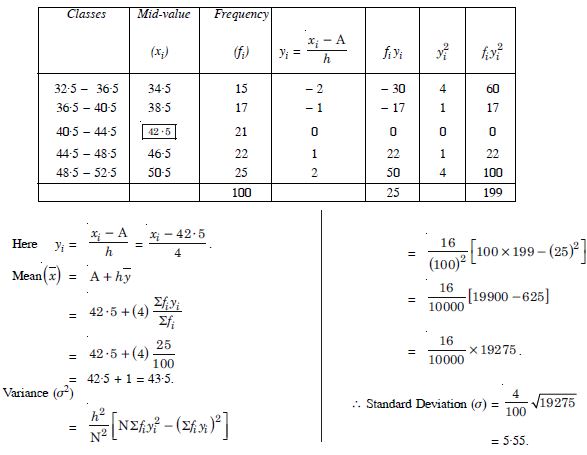
Question 45:
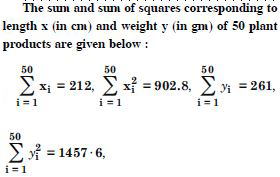
Which is more varying the length or weight ?
Answer: