Question 1:
Describe how the poverty line is estimated in India?
Answer:
Following are the two methods by which poverty line is estimated in India:
(i) Income Method: Under this method, a minimum per capita income is fixed. For instance, in
2011–12, the income was fixed at Rs 816 and Rs 1000 per capita per month in rural and urban
areas respectively. If any family has an income less than the fixed income, it is considered
as below
the poverty line. This method is used to distribute food at subsidised prices through
PDS.
(ii) Expenditure Method: Under this method, the minimum nutritional food requirement for
survival
is estimated. The total minimum food requirement is firstly measured in calories, which is
then
converted into money value, i.e. in rupees. A minimum amount which is required for clothes
and other
requirements is added to the money value of food. This total amount is considered as poverty
line.
Question 2:
Do you think that the present methodology of poverty estimation is appropriate?
Answer:
The present methodology of poverty estimation is only a quantitative concept and hence, is
not
appropriate. It discusses a concise meaning of the term poverty to the people. It talks
about a ‘minimal’
subsistence level of living and not the ‘reasonable’ level of living. Many economists
recommend the
need to broaden the concept to human poverty.
The aspects such as education, health, job, self-confidence, equality, etc., should also be
included
while calculating poverty. These aspects are important to measure as they determine the
overall
quality of life.
Question 3:
Describe poverty trends in India since 1973.
Answer:
According to the Economic Survey 2011–12, there has been a significant decline in poverty
ratios
in India from about 44.3 per cent in 1993 to 37.2 per cent in 2004–05. Since then, however,
the
proportion of people living below poverty line has rather increased to 22 per cent in
2011–12.
Although the percentage of people living under poverty declined in the earlier two decades
(1993–2004), the number of poor remained stable around 400 million for a fairly long period.
The
latest estimates indicate a significant reduction in the number of poor to about 22 per cent
by 2011–12.
Question 4:
Discuss the major reasons for poverty in India.
Answer:
There are various reasons for poverty in India. These are:
(i) The economic development was very low under the British administration. The British
policies
destroyed the traditional Indian handicrafts and hampered the growth of industries like
textile.
This eliminated the source of income for large segment of India’s population.
(ii) Green revolution created many job opportunities the agricultural sector. However, its
effects
were confined to limited parts of India.
(iii) There has been huge inequality in distribution of income in the country. This is
mainly because of
unequal distribution of land and other resources.
(iv) Lack of land resources and indebtedness had aggravated to the cause of poverty.
Question 5:
Identify the social and economic groups which are most vulnerable to poverty in India.
Answer:
Groups that are most vulnerable to poverty in India are:
(i) Social Group – Schedule Caste (SC) and Schedule Tribe (ST) households
(ii) Economic Group – Rural agricultural labour households and urban casual labour
households
Question 6:
Give an account of the interstate disparities of poverty in India.
Answer:
There have been significant interstate disparities prevalent in India in terms of poverty.
Although there
has been decline in poverty since independence, the success rate of poverty reduction varies
from
state to state. The proportion of people living below poverty line is not the same in every
state of
India.
(i) Poverty Ratio more than National Average: Assam, Bihar, Odisha, Uttar Pradesh and
Tripura are
the most poverty ridden states of India. Among these, Bihar and Odisha are the poorest
states
with poverty ratio of 43% and 47% respectively.
(ii) Poverty Ratio less than National Average: Haryana, Punjab, Goa, Himachal Pradesh, Tamil
Nadu,
Kerala, Andhra Pradesh, Gujarat and West Bengal are some states having very low percentage
of population living below the poverty line. Recent studies show that in 20 states and union
territories, the poverty ratio is less than the national average.
Question 7:
Describe global poverty trends.
Answer:
The World Bank defines poverty as living on less than $1.25 per day. There has been a
substantial
reduction in global poverty. It has fallen from 43 per cent in 1990 to 22 per cent in
2008.
Regional Variation
The reduction in global poverty is marked with great regional variation. While poverty
declined
substantially in South-East Asian countries and China as a result of massive investment in
human
resources development and rapid economic growth, the pace of reduction of poverty in South
Asian countries is very slow.
(i) Poverty in India: Poverty in India has declined. However, the pace of reduction is very
slow.
According to World Bank’s definition of poverty line (2011), 22% of India’s total population
is
still living below the poverty line.
(ii) Poverty in Sub-Saharan Africa: In Sub-Saharan Africa, poverty has declined by mere 3
per cent
from 1981 to 2008. Sub-Sahara includes Algeria, Libya, Nigeria, China, etc.
(iii) Poverty in Russia: The poverty has also been evident in the former socialist countries
like
Russia, where earlier it was not-existent.
Question 8:
Describe current government strategy of poverty alleviation.
Answer:
The current anti-poverty strategy of the government is broadly based on many schemes and
programmes. Some of them have been mentioned below:
(i) National Rural Employment Guarantee Act (NREGA) 2005: This programme was launched in
2005 and aimed at providing wage employment for 100 days to every rural household. Onethird
jobs were reserved for the women.
(ii) National Food for Work Programme (NFWP): This programme was launched in 2004 in 150
most backward districts of country. The programme is open to all rural poor who are in need
of
wage employment and desire to do manual unskilled work.
(iii) Prime Minister Rozgar Yozana (PMRY): This scheme was started in 1993. It aims at
creating selfemployment
opportunities for the educated unemployed youth in the rural areas and small towns.
(iv) Rural Employment Generation Programme (REGP): It was launched in 1995. It aims at
creating
self-employment opportunities in the rural areas and small towns.
Question 9:
What do you understand by human poverty?
Answer:
Human poverty is an inefficiency to satisfy minimum basic needs such as food, clothing and shelter.
Question 10:
Who are the poorest of the poor?
Answer:
Apart from the social groups, there are inequalities of income within a family as well. All suffer in poor families, but elderly people, women and female infants suffer the most as they are denied equal access to the resources available to their family. They are called the ‘poorest of the poor’.
Question 11:
What are the main features of the National Rural Employment Guarantee Act 2005?
Answer:
The National Rural Employment Guarantee Act (NREGA) was passed in September 2005. The
main features of NREGA Act 2005 are:
(a) The act provides 100 days assured employment to every rural household in 200 districts.
(b) The central government will also establish National Employment Guarantee Funds.
(c) There is a plan to extend the scheme to 600 districts. One-third of the proposed jobs
would
be reserved for women.
(d) Under the programme, if an applicant is not provided employment within 15 days, he/she
will
be entitled to a daily unemployment allowance.
Question 12:
Why do different countries use different poverty lines?
Answer:
The basic needs of different countries are different. Thus, different countries use different poverty lines. For example, a person may be considered poor in America if he is not having a car, whereas in India, owning a car is considered a luxury.
Question 13:
Study the table and answer the following questions:
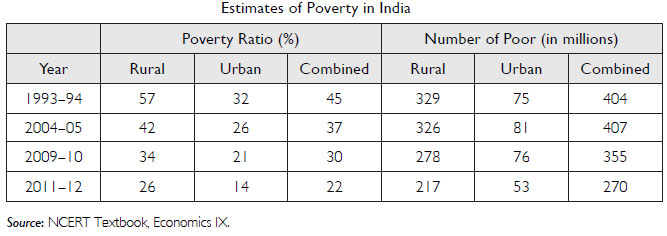
Even if poverty ratio declined between 1993–94 and 2004–05, why did the number of poor remain at about 407 million?
Answer:
Even if poverty ratio declined between 1993–94 and 2004–05, the number of poor remained at about 407 million because of rapid increase in population.
Question 14:
Study the table and answer the following questions:
Are the dynamics of poverty reduction the same in rural and urban India?
Answer:
No, the dynamics of poverty reduction are not the same in rural and urban India. The proportion of poor in rural areas has always been more than that of poor in urban areas.
Question 15:
Observe some of the poor families around you and try to find the following:
Which social and economic group do they belong to?
Answer:
They belong to social groups like scheduled tribes and scheduled castes households and economic group like rural agricultural labour household.
Question 16:
Observe some of the poor families around you and try to find the following:
Who are the earning members in the family?
Answer:
They belong to social groups like scheduled tribes and scheduled castes households and economic group like rural agricultural labour household.
Question 17:
Observe some of the poor families around you and try to find the following:
Who are the earning members in the family?
Answer:
Both male and female members earn in the family. In some families, children also work to earn.
Question 18:
Observe some of the poor families around you and try to find the following:
What is the condition of the old people in the family?
Answer:
The condition of the old people in the family is the most vulnerable.
Question 19:
Observe some of the poor families around you and try to find the following:
Are all the children (boys and girls) attending schools?
Answer:
All the children (boys and girls) are not attending the schools. Some girls are still at home.
Question 20:
Study the graph and do the following:
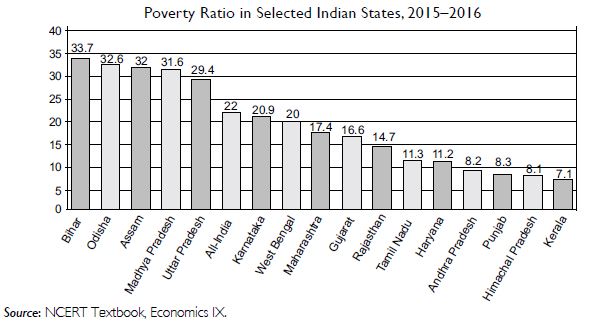
Identify the three states where poverty ratio is the highest.
Answer:
The poverty ratio is the highest in Bihar, Odisha and Assam.
Question 21:
Study the graph and do the following:
Identify the three states where poverty ratio is the lowest.
Answer:
The poverty ratio is lowest in Kerala, Himachal Pradesh and Punjab.
Question 22:
Study the graph and do the following:
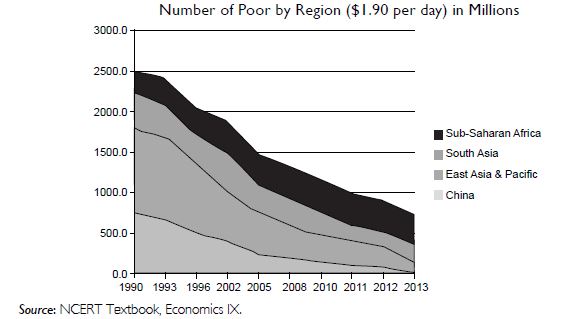
Identify the areas of the world, where poverty ratios have declined.
Answer:
Poverty ratios have declined in all the areas shown in the graph. However, it has declined significantly in East Asia and the Pacific.