Question 1:
How would you find the average of your study hours for the whole week?
Answer:
Students can arrange the data with the help of their parents and solve the questions with the help of teacher.
Question 2:
Find at least 5 numbers between ½ and ⅓.
Answer:
To solve this problem, we must use method of mean.

Question 3:
Organise the following marks in a class assessment, in a tabular form.
4, 6, 7, 5, 3, 5, 4, 5, 2, 6, 2, 5, 1, 9, 6, 5, 8, 4, 6, 7
(i) Which number is the highest?
(ii) Which number is the lowest?
(iii) What is the range of the data?
(iv) Find the arithmetic mean.
Answer:

Question 4:
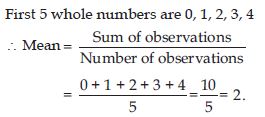
Find the mean of first 5 whole numbers.
Answer:
Question 5:
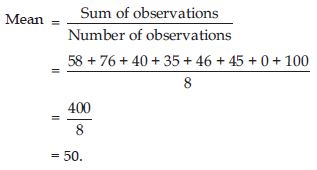
A cricketer scores the following runs in 8 innings:
58, 76, 40, 35, 46, 45, 0, 100
Find mean score.
Answer:
Question 6:
Following table shows the points of each player scored in four games:
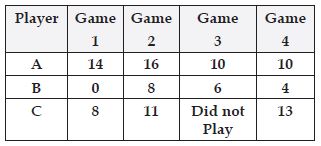
Now answer the following questions:
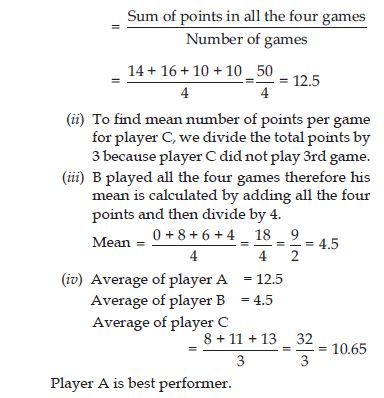
(i) Find the mean to determine A’s average number of points scored per game.
(ii) To find the mean number of points per game for C, would you divide the total points by
3 or by 4? Why?
(iii) B played in all the four games. How would you find the mean?
(iv) Who is the best performer?
Answer:
(i) A’s average number of points scored per game
Question 7:
The marks (out of 100) obtained by a group of students in science test are 85, 76, 90, 85,
39, 48, 56, 95, 81 and 75. Find the:
(i) highest and the lowest marks obtained by the students.
(ii) range of the marks obtained.
(iii) mean marks obtained by the group.
Answer:
Marks obtained by 10 students:
85, 76, 90, 85, 39, 48, 56, 95, 81 and 75.
(i) Highest marks obtained by a student = 95
Lowest marks obtained by a student = 39
(ii) Range of Marks obtained
= Highest marks – Lowest marks
= 95 – 39 = 56
(iii) Mean marks obtained by the group
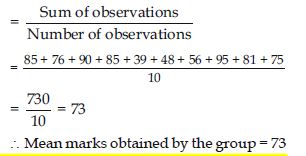
Question 8:
The enrolment of a school during six consecutive years was as follows: 1555, 1670, 1750, 2013, 2540, 2820. Find the mean enrolment of the school for this period.
Answer:
The enrolment of a school during six consecutive years:
1555, 1670, 1750, 2013, 2540, 2820
Mean enrolment
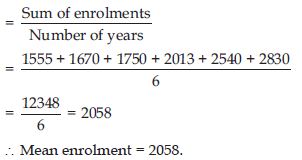
Question 9:
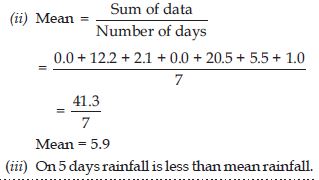
The rainfall (in mm) in a city on 7 days of a certain week was recorded as follows:
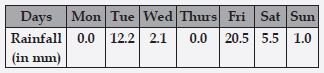
(i) Find the range of the rainfall in the above data.
(ii) Find the mean rainfall for the week.
(iii) On how many days was the rainfall less than the mean rainfall.
Answer:
(i) Range of data = Highest rainfall – Lowest rainfall
= 20.5 – 0.0
∴ Range of data = 20.5 mm
Question 10:
The heights of 10 girls were measured in cm and the results are as follows:
135, 150, 139, 128, 151, 132, 146, 149, 143, 141.
(i) What is the height of the tallest girl?
(ii) What is the height of the shortest girl?
(iii) What is the range of the data?
(iv) What is the mean height of the girls?
(v) How many girls have heights more than the mean height?
Answer:
Arrange the data in ascending order
128, 132, 135, 139, 141, 143, 146, 149, 150, 151
(i) Height of tallest girl = 151 cm.
(ii) Height of shortest girl = 128 cm.
(iii) Range of the data = 151 – 128 = 23.
(iv) Mean height of girls
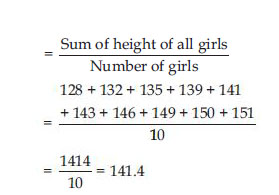
Mean height of girls = 141.4 cm.
(v) Five girls have more height than the mean height.
Question 11:
Find the mode of 2, 6, 5, 3, 0, 3, 4, 3, 2, 4, 5, 2, 4.
Answer:
Arranging the data in ascending order:
0, 2, 2, 2, 3, 3, 3, 4, 4, 4, 5, 5, 6.
Here, 2, 3 and 4 occur three times.
Therefore, they are modes of the data.
Question 12:
Find the mode of 2, 14, 16, 12, 14, 14, 16, 14, 10, 14, 18, 14.
Answer:
Arranging the data in ascending order:
2, 10, 12, 14, 14, 14, 14, 14, 14, 16, 16, 18.
Here, 14 occurs six times.
Therefore, 14 is the mode of the data.
Question 13:
Can a set of numbers have more than one mode?
Answer:
Yes, a set of numbers can have more than one mode.
Question 14:
Find the mode of the following data:
12, 14, 12, 16, 15, 13, 14, 18, 19, 12, 14, 15, 16, 15, 16, 16, 15, 17, 13, 16, 16, 15, 15,
13, 15, 17, 15, 14, 15, 13, 15, 14
Answer:
Arranging the data in ascending order:
12, 12, 12, 13, 13, 13, 13, 14, 14, 14, 14, 14, 15, 15, 15, 15, 15, 15, 15, 15, 15, 15, 16,
16, 16, 16, 16, 16, 17, 17, 18, 19
Here, 15 occurs more frequently.
∴ Mode = 15.
Question 15:
Heights (in cm) of 25 children are given below: 168, 165, 163, 160, 163, 161, 162, 164, 163, 162, 164, 163, 160, 163, 163, 165, 163, 162, 163, 164, 163, 160, 165, 163, 162. What is the mode of their heights? What do we understand by mode here?
Answer:
Arranging the data in ascending order:
160 cm, 160 cm, 160 cm, 161 cm, 162 cm, 162 cm, 162 cm, 162 cm, 163 cm, 163 cm, 163 cm, 163
cm, 163 cm, 163 cm, 163 cm, 163 cm, 163 cm, 163 cm, 164 cm, 164 cm, 164 cm, 165 cm, 165 cm,
165 cm, 168 cm.
Here, 163 cm occurs more frequently.
∴ Mode of their heights is 163 cm. Here by mode we understand that most of the students are
of 163 cm height.
Question 17:
Your friend found the median and the mode of a given data. Describe and correct your friend’s
error if any:
35, 32, 35, 42, 38, 32, 34
Median = 42, Mode = 32
Answer:
Arranging the data in ascending order:
32, 32, 34, 35, 35, 38, 42
Here, 32 and 35 occurs two times.
∴ Mode = 32, 35 and Median is 35.
Question 18:
The scores in mathematics test (out of 25) of 15 students is as follows:
19, 25, 23, 20, 9, 20, 15, 10, 5, 16, 25, 20, 24, 12, 20.
Find the mode and median of the data.
Are they same?
Answer:
We arrange the data in ascending order:
5, 9, 10, 12, 15, 16, 19, 20, 20, 20, 20, 23, 24, 25, 25
Here, 20 occurs more frequently
∴ Mode = 20
Median is the middle observation
∴ 20 is the median.
Yes, both mode and median are same.
Question 19:
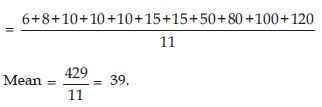
The runs scored in a cricket match by 11 players is as follows:
6, 15, 120, 50, 100, 80, 10, 15, 8, 10, 15.
Find the mean, mode and median of this data. Are the three same?
Answer:
We arrange the data in ascending order:
6, 8, 10, 10, 15, 15, 15, 50, 80, 100, 120
∴ Mode = 15
∴ Median is the middle observation
∴ 15 is median.
Mean, mode and median are not same.
Question 20:
The weights (in kg) of 15 students of a class are:
38, 42, 35, 45, 37, 50, 32, 43, 43, 40, 36, 38, 43, 38, 47
(i) Find the mode and median of this data.
(ii) Is there more than one mode?
Answer:
(i) We arrange the data in ascending order
25, 32, 36, 37, 38, 38, 38, 40, 42, 43, 43, 43, 45, 47, 50
Mode: Here 38 and 43 occurs more frequently i.e. 3 times
∴ Mode = 38 and 43
Median is the middle observation
∴ 40 is median.
(ii) Yes, there are two mode i.e., 38 and 43.
Question 21:
Find the mode and median of the following data:
13, 16, 12, 14, 19, 12, 14, 13, 14
Answer:
We arrange the data in ascending order
12, 12, 13, 13, 14, 14, 14, 16, 19
Here, 14 occurs more frequently
∴ Mode = 14
Median is middle observation
∴ 14 is median.
Question 22:
The mode is always one of the numbers in a data.
- True
- False
Answer:
True
Question 23:
The mean can be one of the numbers in a data.
- True
- False
Answer:
False
Question 24:
The median is always one of the number in a data.
- True
- False
Answer:
False
Question 25:
The data 6, 4, 3, 8, 9, 12, 13, 9 has mean 9.
- True
- False
Answer:
False
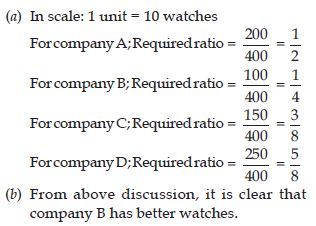
Question 26:
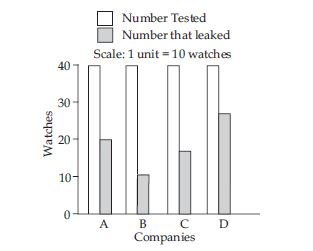
The bar graph (in figure) shows the result of a survey to test water resistant watches made
by different companies. Each of these companies claimed that their watches were water
resistant. After a test the above results were revealed.
(a) Can you work out a fraction of the number of watches that leaked to the number tested
for each company?
(b) Could you tell on this basis which company has better watches?
Answer:
Question 27:
Sale of English and Hindi books in the years 1995, 1996, 1997 and 1998 are given below:
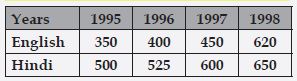
Draw a double bar graph and answer the following questions:
(a) In which year was the difference in the sale of the two language books least?
(b) Can you say that the demand for English books rose faster? Justify.
Answer:
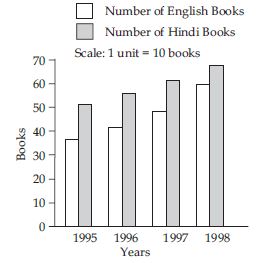
(a) In 1998, the difference in the sale of two language books is least.
(b) As the difference of English books in 1995- 1996 is 50 and in 1996-97 is also 50 then,
1997-1998 it rises up to 170 which shows that in each year demand of book rises by 50 and
more.
But in Hindi books, first it rises up to 25 then 75 then it rises up to 50 only which is
less as compared to English books.
Question 28:
Use the bar graph to answer the following questions.
(a) Which is the most popular pet?
(b) How many students have dog as a pet?
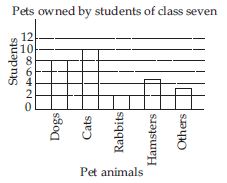
Answer:
(a) Cat is the most popular pet.
(b) 8 children have dog as pet.
Question 29:
Read the bar graph which shows the number of books sold by a bookstore during five consecutive years and answer the following questions:
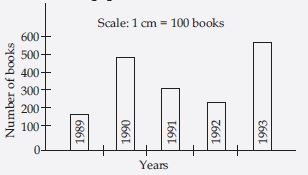
(i) About how many books were sold in 1989? 1990? 1992?
(ii) In which year were about 475 books sold? About 225 books sold?
(iii) In which years were fewer than 250 books sold?
(iv) Can you explain how you would estimate the number of books sold in 1989?
Answer:
(i) In 1989 about 200, 1990 about 500 and in 1992 about 250 books were sold.
(ii) In 1990 about 475 books were sold. In 1992 about 225 books were sold.
(iii) In the years 1989 and 1992 fewer than 250 books were sold.
(iv) From the bar graph, it is clear that number of books sold in 1989 is 200.
Question 30:
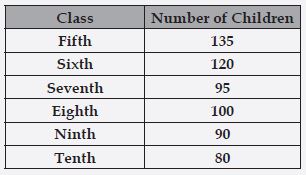
Number of children in six different classes are given below. Represent the data on a bar graph.
(a) How would you choose a scale?
(b) Answer the following questions:
(i) Which class has the maximum number of children? And the minimum?
(ii) Find the ratio of students of class sixth to the students of class eight.
Answer:
Start the scale at 0. The greatest value of data is 135 so end the scale at value greater
than 135 such as 140, use equal division along axes such as increment of 10. Here we take 1
unit for 10 children.
(a) One small unit = 10 students
(b) (i) Maximum number of students are in fifth class and minimum numbers of students are in
tenth class.
(ii)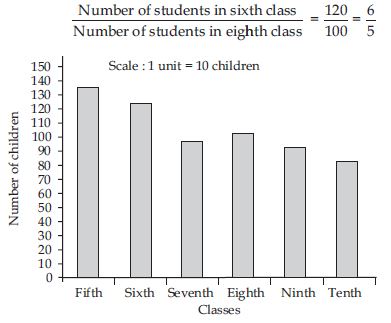
Question 31:
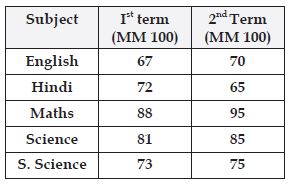
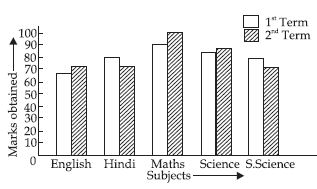
The performance of a student in 1st Term and 2nd Term is given. Draw a double bar graph choosing appropriate scale and answer the following:
(i) In which subject, has the child improved his performance the most?
(ii) In which subject is the improvement the least?
(iii) Has the performance gone down in any subject?
Answer:
(i) In mathematics child improved his performance the most.
(ii) In S. Science, the improvement is the least.
(iii) His performance has gone down in Hindi.
Question 32:
Consider this data collected from a survey of a colony.
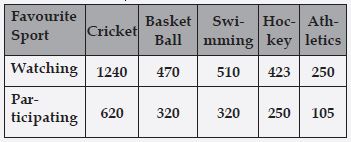
(i) Draw a double bar graph choosing an appropriate scale.
What do you infer from the bar graph?
(ii) Which sport is most popular?
(iii) What is more preferred, watching or participating in sports
Answer:
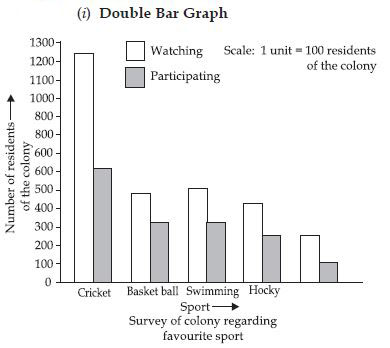
(ii) Cricket is most popular in watching as well as participating.
(iii) Most preferred is watching sports.
Question 33:
Take the data giving the minimum and the maximum temperature of various cities given in the
beginning of this chapter. Plot a double bar graph using the data and answer the
following:
(i) Which city has the largest difference in the minimum and maximum temperature on the
given date?
(ii) Which is the hottest and which is the coldest city?
(iii) Name two cities where maximum temperature of one was less than the minimum temperature
of the other.
(iv) Name the city which has the least difference between its minimum and the maximum
temperature.
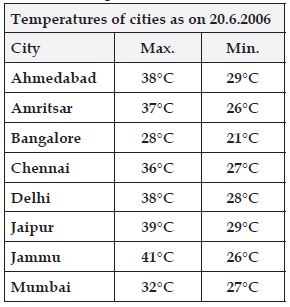
Answer:
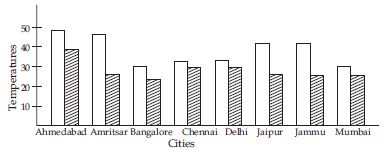
(i) Jammu is the city in which there is largest difference in minimum and maximum
temperature.
(ii) Jammu is hottest city (41C) and Bangalore is coldest city (21C).
(iii) Bangalore and Jaipur or Bangalore and Ahmedabad.
(iv) Mumbai (5C).
Question 34:
Tell whether the following is certain to happen, impossible, can happen but not certain.
(i) You are older today than yesterday.
(ii) A tossed coin will land heads up.
(iii) A die when tossed shall land up with 8 on top.
(iv) The next traffic light seen will be green.
(v) Tomorrow will be a cloudy day.
Answer:
(i) Certain to happen
(ii) Can happen but not certain
(iii) Impossible
(iv) Can happen but not certain
(v) Can happen but not certain
Question 35:
There are 6 marbles in a box with numbers from 1 to 6 marked on each of them.
(i) What is the probability of drawing a marble with number 2?
(ii) What is the probability of drawing marble with number 5?
Answer:
Sample space (Likely possible outcomes) = {1, 2, 3, 4, 5, 6}
(i) Probability of drawing a marble with number 2 = ⅙
(ii) Probability of drawing a marble with numbers 5 = ⅙
Question 36:
A coin is flipped to decide which team starts the game. What is the probability that your team will start?
Answer:
Likely possible outcomes = {Head, Tail}
Required Probability