Students can enhance their exam preparations with top NCERT Solutions available on Aasoka. These solutions, prepared by subject matter experts, are prepared in the context of the latest syllabus and exam guidelines. The NCERT Solutions for Class 10th is available online for free on the Aasoka platform. These can easily be accessed by students to kick start their learning journey and get to understand the topic better.
“Statistics” is a chapter that talks about grouped, ungrouped, mean, median, mode, the numerical representation of data, drawing cumulative frequency curves, cumulative frequency distribution, and so much more.
Question 1:
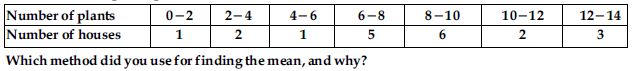
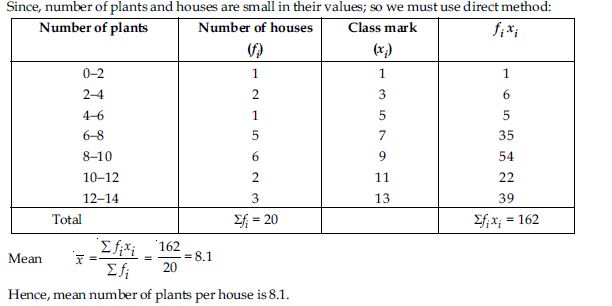
A survey was conducted by a group of students as a part of their environment awareness programme, in which they collected the following data regarding the number of plants in 20 houses in a locality. Find the mean number of plants per house.
Answer:
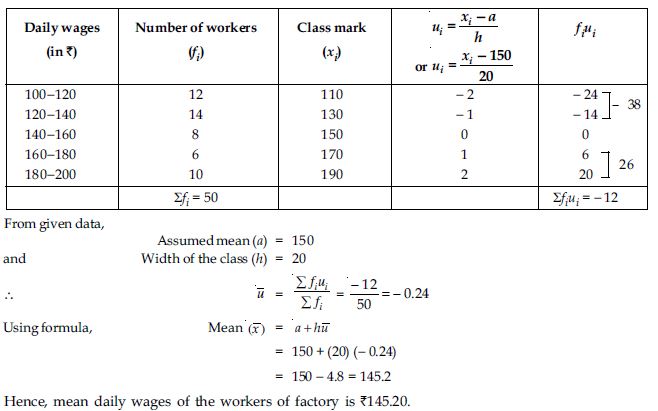
Question 2:
Consider the following distribution of daily wages of 50 workers of a factory.
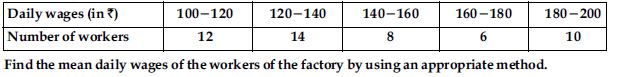
Answer:
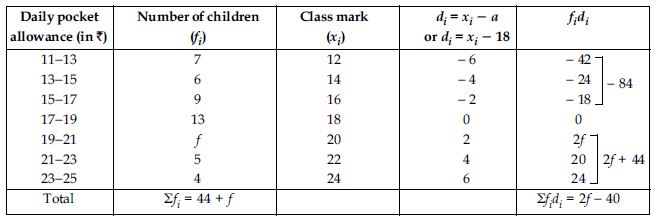
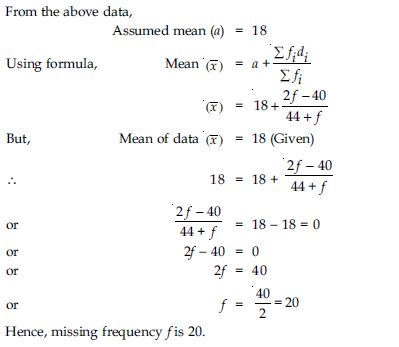
Question 3:
The following distribution shows the daily pocket allowance of children of a locality. The mean pocket allowance is ₹ 18. Find the missing frequency f.
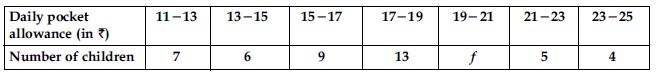
Answer:
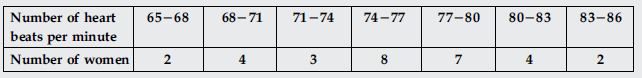
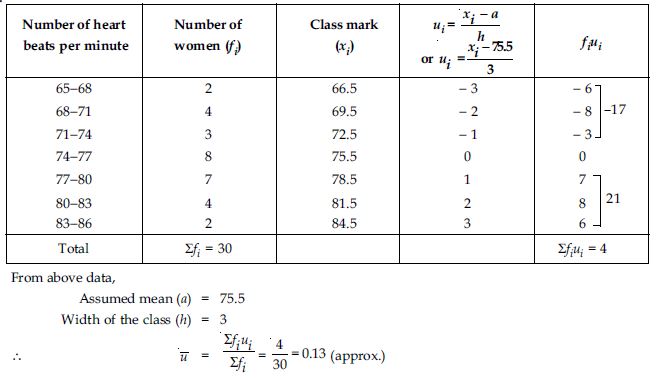
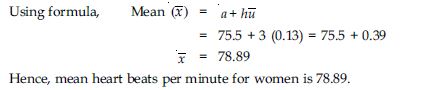
Question 4:
Thirty women were examined in a hospital by a doctor and the number of heart beats per minute were recorded and summarised as follows. Find the mean heart beats per minute for these women, choosing a suitable method.
Answer:
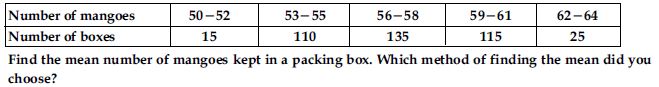
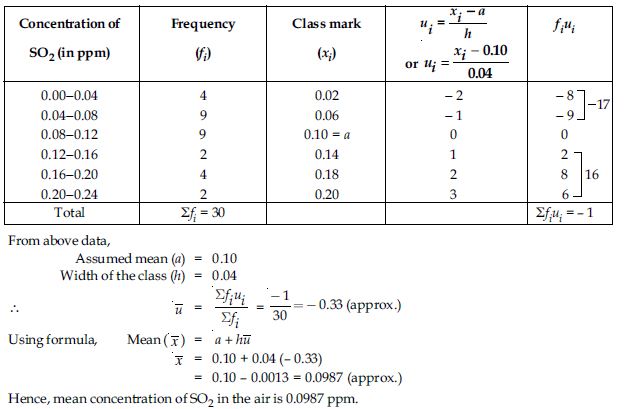
Question 5:
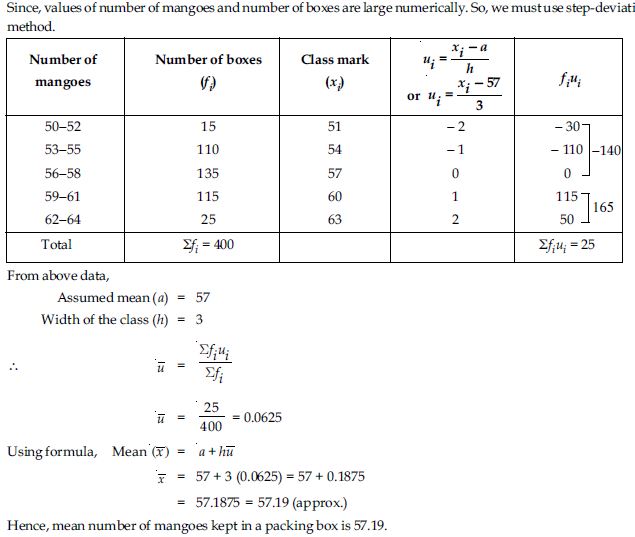
In a retail market, fruit vendors were selling mangoes kept in packing boxes. These boxes contained varying number of mangoes. The following was the distribution of mangoes according to the number of boxes.
Answer:
Question 6:
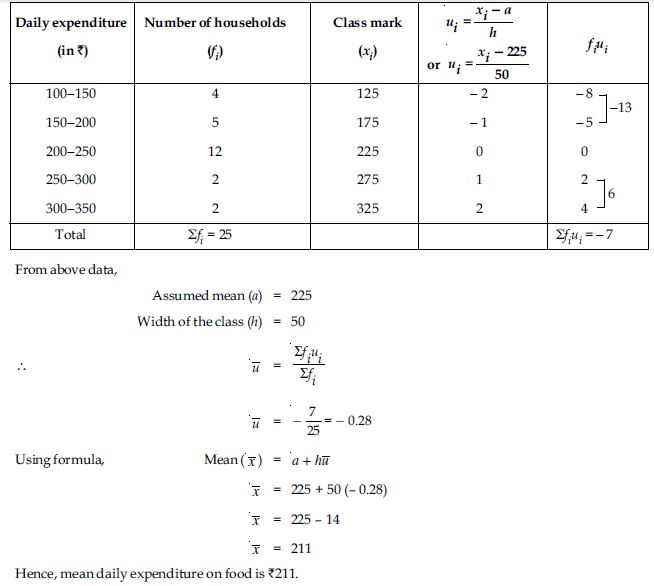
The table below shows the daily expenditure on food of 25 households in a locality.
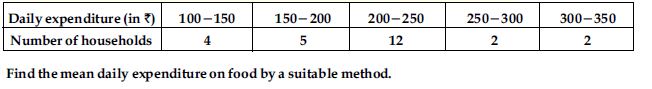
Answer:
Question 7:

Answer:
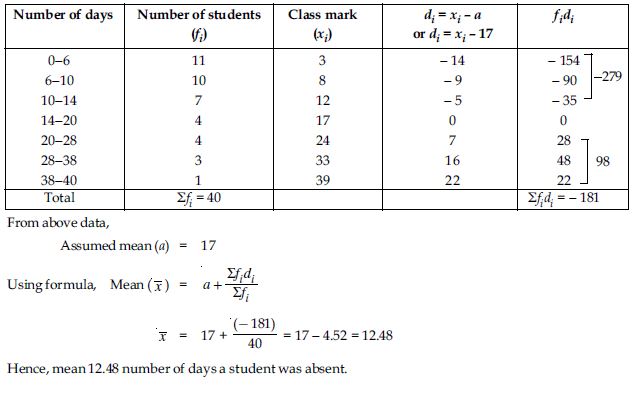
Question 8:
A class teacher has the following absentee record of 40 students of a class for the whole term. Find the mean number of days a student was absent.

Answer:
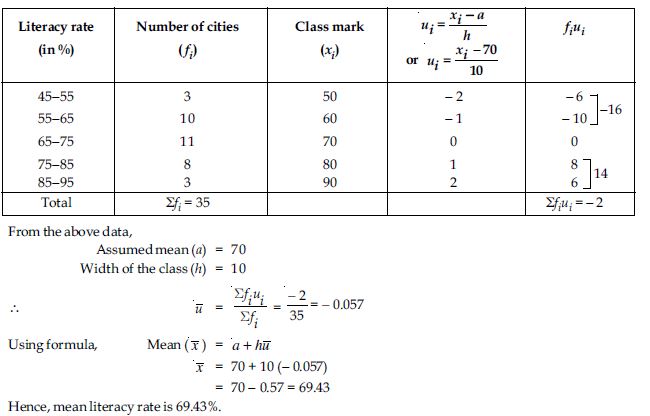
Question 9:
The following table gives the literacy rate (in percentage) of 35 cities. Find the mean literacy rate.

Answer:
Question 10:
The following table shows the ages of the patients admitted in a hospital during a year:
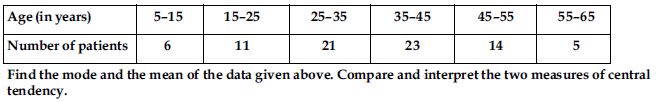
Answer:
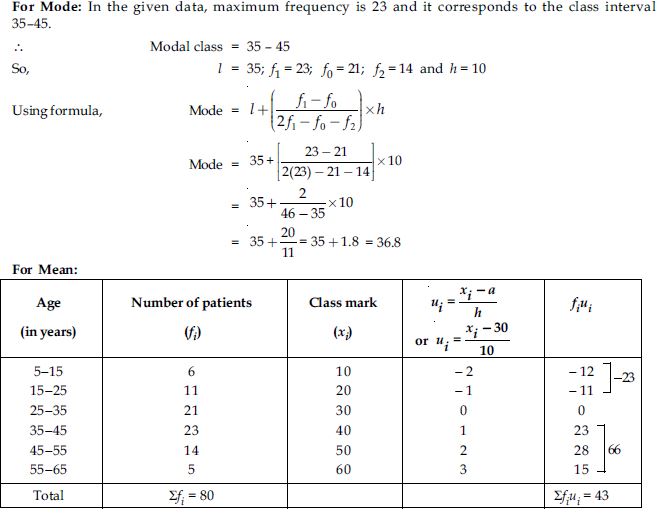
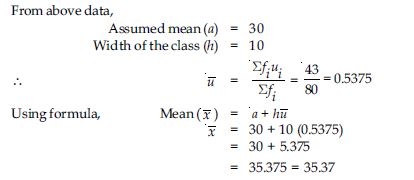
Hence, mode of given data is 36.8 years and mean of the given data is 35.37 years.
Also, it is clear from above discussion that average age of a patient admitted in the hospital is 35.37 years and maximum number of patients admitted in the hospital are of age 36.8 years.
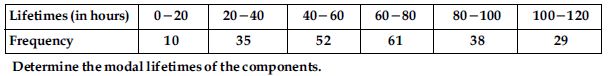
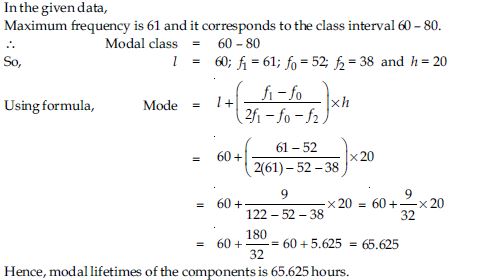
Question 11:
The following data gives the information on the observed lifetimes (in hours) of 225 electrical components:
Answer:
Question 12:
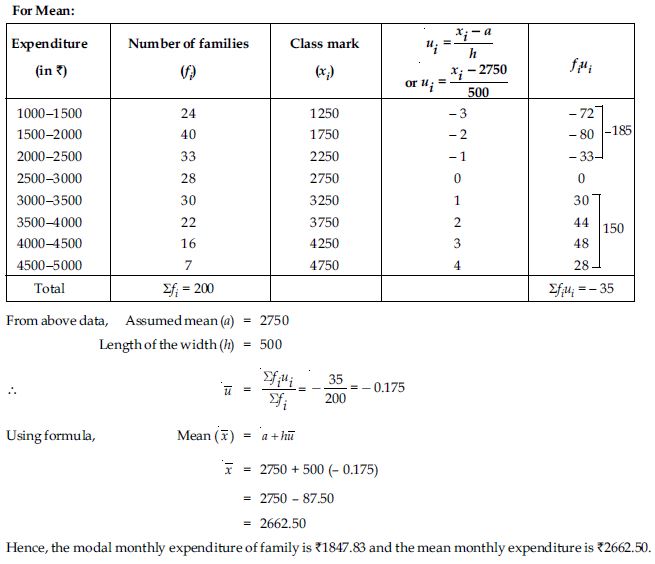
The following data gives the distribution of total monthly household expenditure of 200 families of a village. Find the modal monthly expenditure of the families. Also, find the mean monthly expenditure:
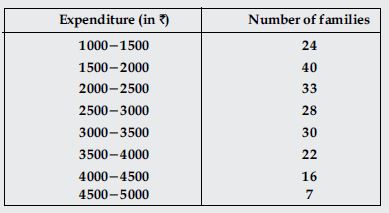
Answer:
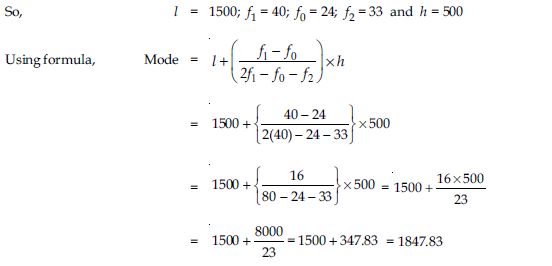
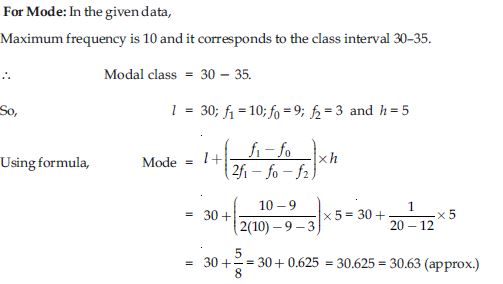
For Mode: In the given data,
Maximum frequency is 40 and it corresponds to the class interval 1500 − 2000.
∴ Modal class = 1500 − 2000
Question 13:
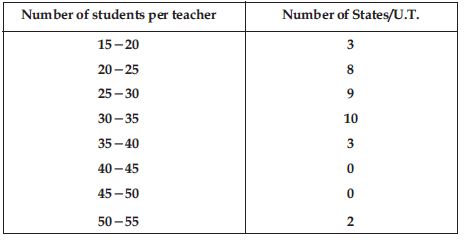
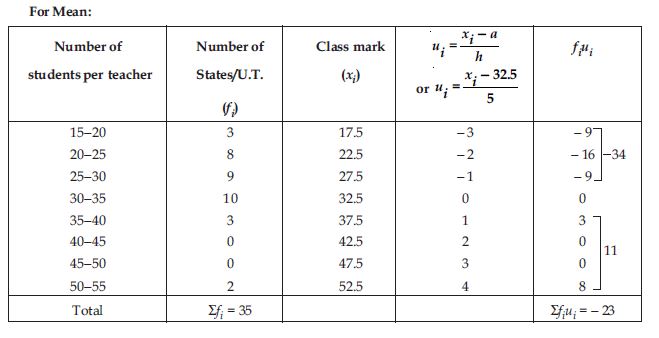
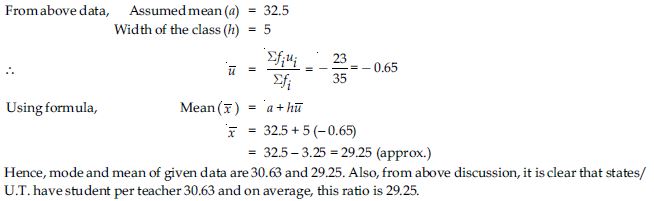
The following distribution gives the state-wise teacher-student ratio in higher secondary
schools of India.
Find the mode and mean of this data. Interpret, the two measures.
Answer:
Question 14:
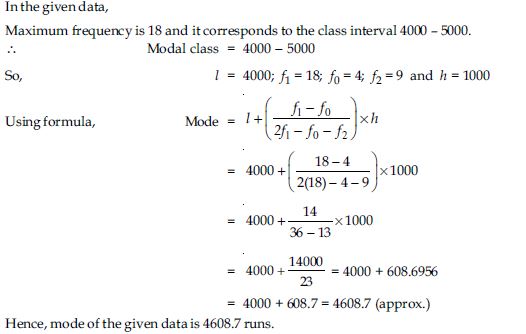
The given distribution shows the number of runs scored by some top batsmen of the world in one-day international cricket matches.
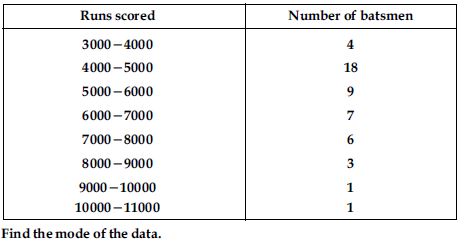
Answer:
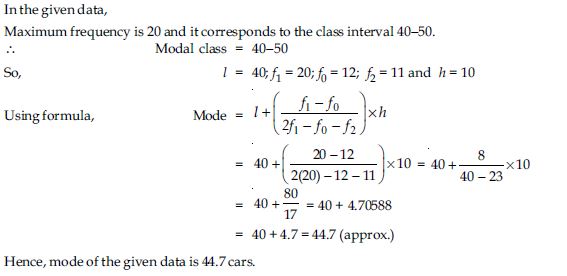
Question 15:
A student noted the number of cars passing through a spot on a road for 100 periods each of 3 minutes and summarised it in the table given below. Find the mode of the data:

Answer:
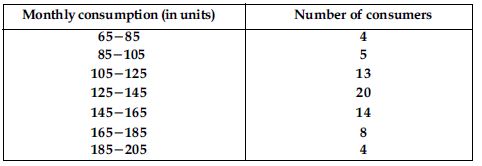
Question 16:
The following frequency distribution gives the monthly consumption of electricity of 68 consumers of a locality. Find the median, mean and mode of the data and compare them.
Answer:
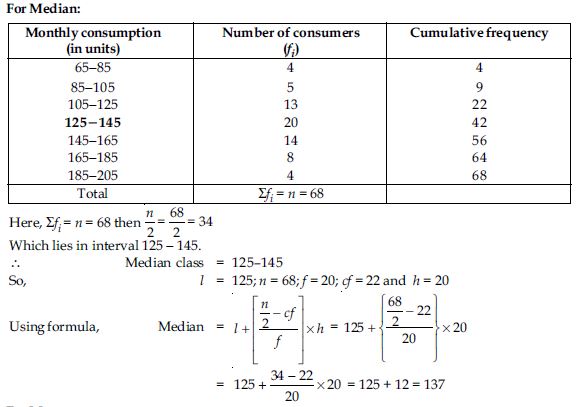
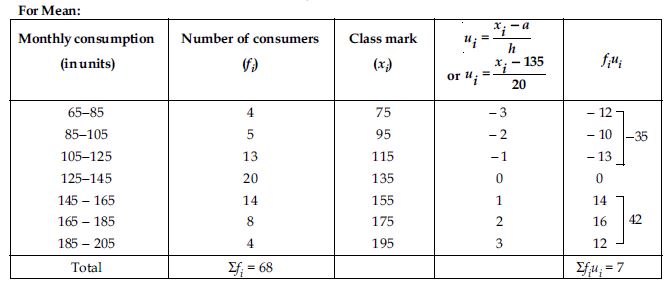
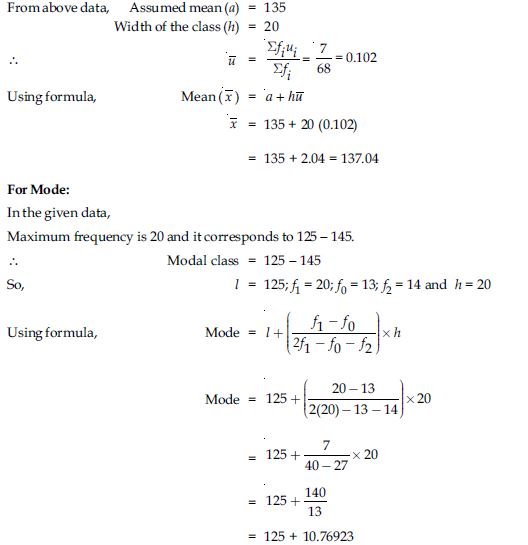
= 125 + 10.77 = 135.77
Hence, median, mean and mode of given data is 137 units; 137.04 units and 135.77 units.
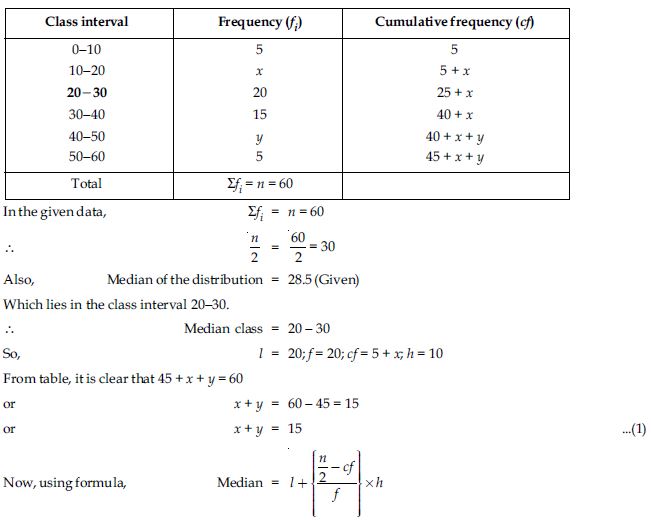
Question 17:
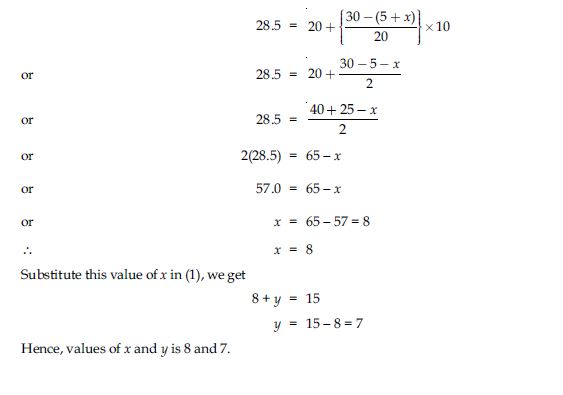
If the median of the distribution given below is 28.5, find the values of x and y.
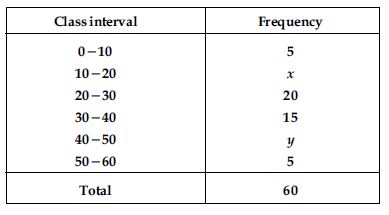
Answer:
Question 18:
A life insurance agent found the following data for distribution of ages of 100 policy holders. Calculate the median age, if policies are given only to persons having age 18 years onwards but less than 60 year.
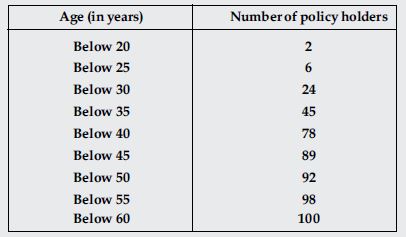
Answer:
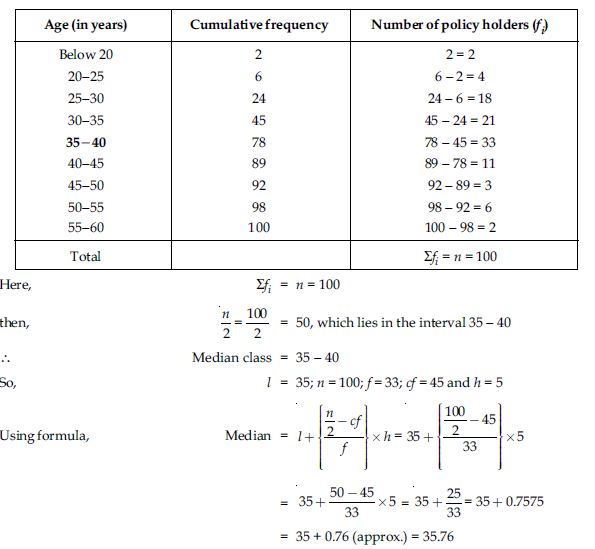
Hence, median age of given data is 35.76 years.
Question 19:
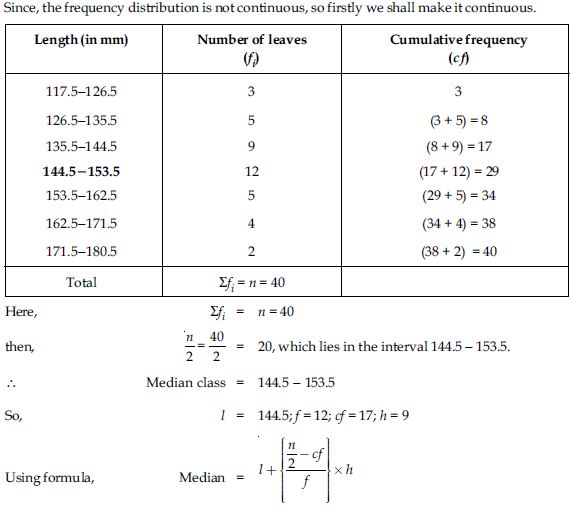
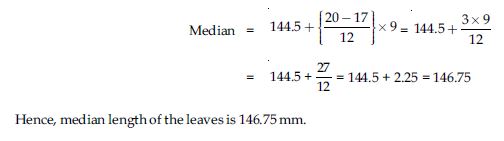
The lengths of 40 leaves of a plant are measured correct to the nearest millimetre, and the data obtained is represented in the following table:
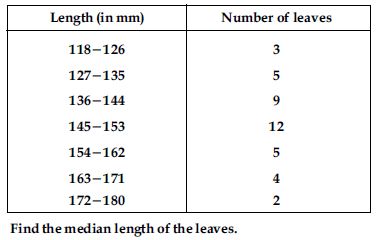
Answer:
Question 20:
The following table gives the distribution of the lifetime of 400 neon lamps:
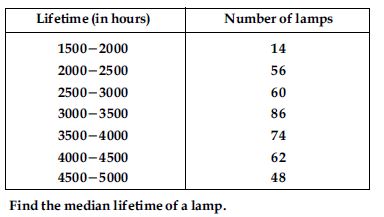
Answer:
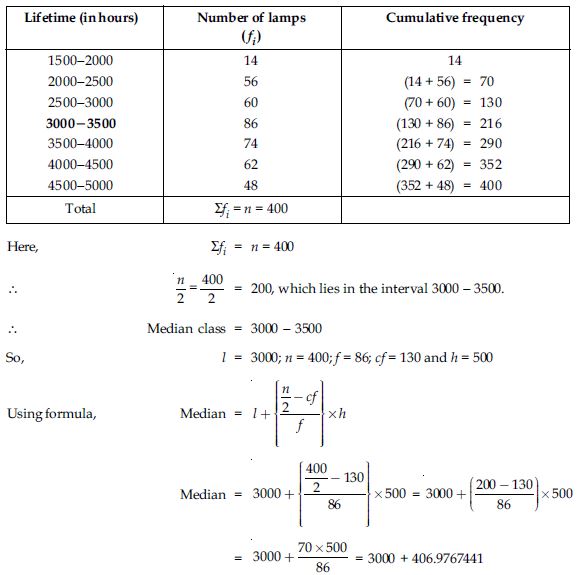
= 3000 + 406.98 (approx.) = 3406.98
Hence, median lifetime of a lamp is 3406.98 hours.
Question 21:
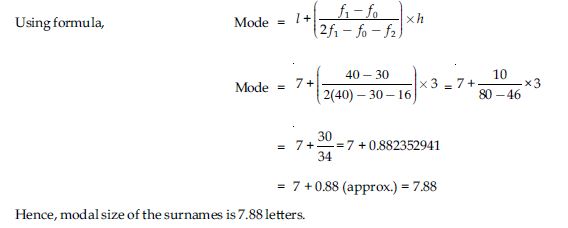
100 surnames were randomly picked up from a local telephone directory and the frequency distribution of the number of letters in the English alphabets in the surnames was obtained as follows:
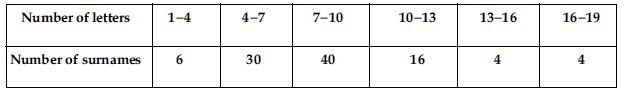
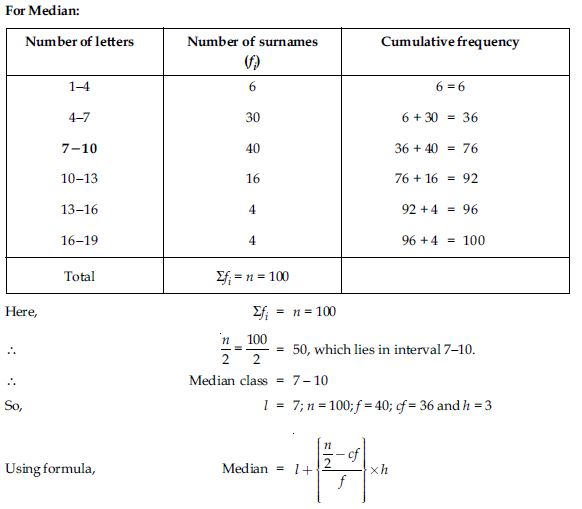
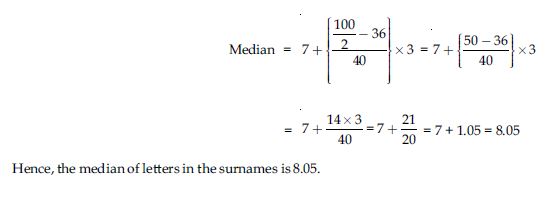
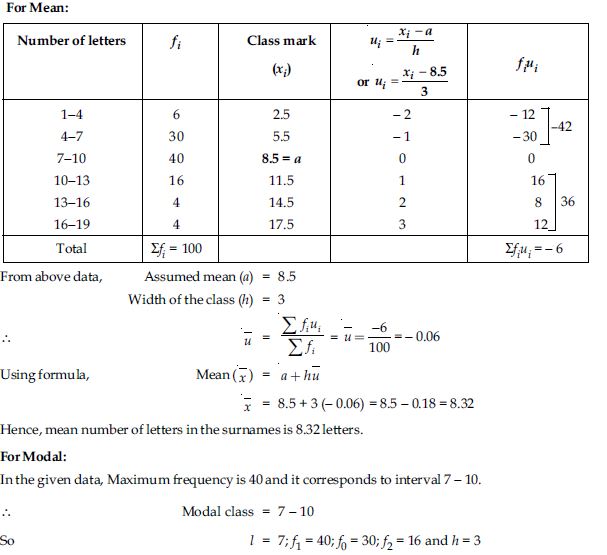
Determine the median number of letters in the surnames. Find the mean number of letters in the surnames. Also, find the modal size of the surnames.
Answer:
Question 22:
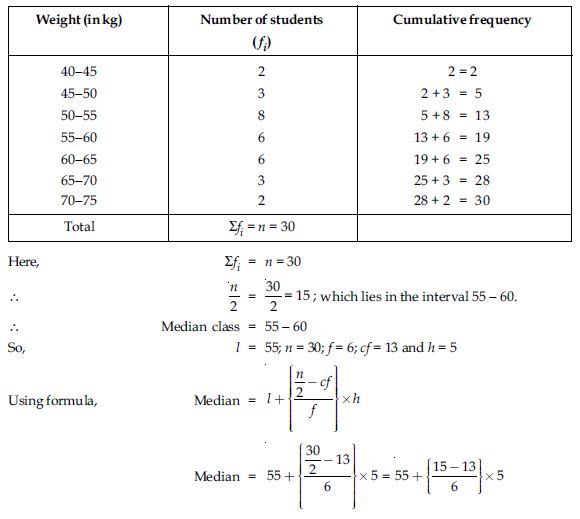
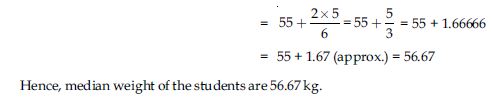
The distribution below gives the weights of 30 students of a class. Find the median weight of the students.
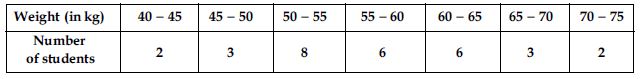
Answer:
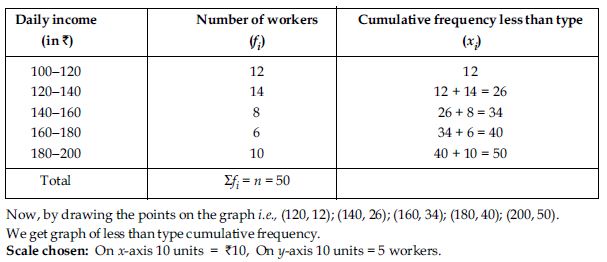
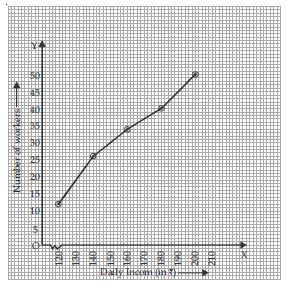
Question 23:
The following distribution gives the daily income of 50 workers of a factory.
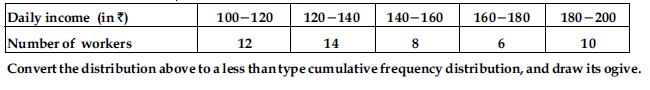
Answer:
Question 24:
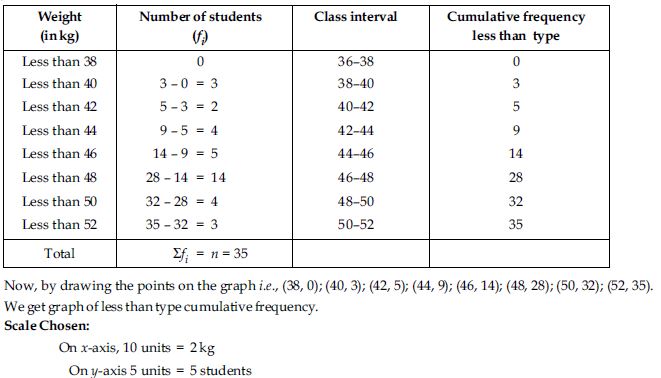
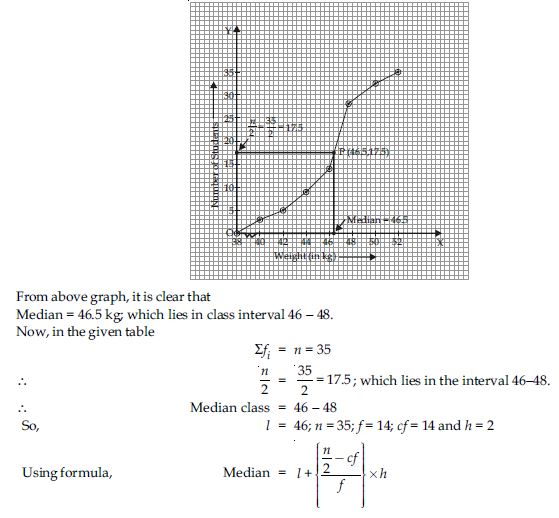
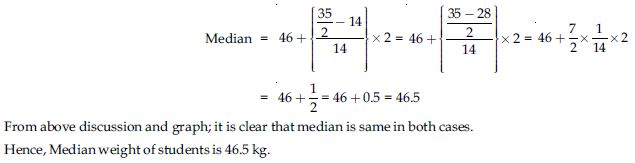
During the medical check up of 35 students of a class, their weights were recorded as follows:
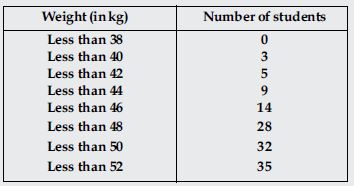
Draw a less than type ogive for the given data. Hence obtain the median weight from the graph and verify the result by using the formula.
Answer:
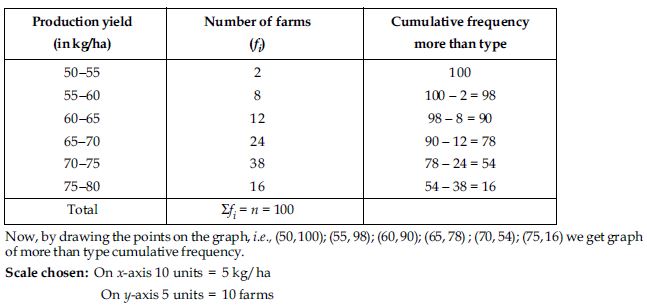
Question 25:
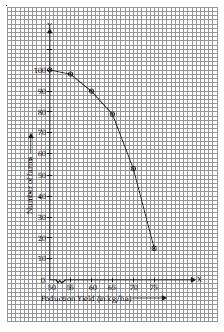
The following table gives production yield per hectare of wheat of 100 farms of a village.
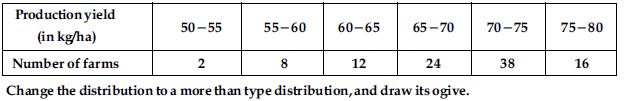
Answer: